Apply Advanced Analysis to a View (Analytics Pane)
Drag reference lines, box plots, trend lines, forecasts, and other items into your view from the Analytics pane. Toggle between theData pane and the Analytics pane by clicking the tabs at the top of the left side bar.
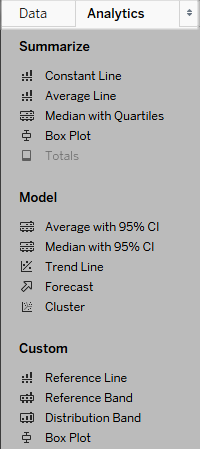
Tableau Desktop Analytics pane
In Tableau Desktop, options for adding Analytics objects to the view are available the Analytics pane or menu, or in context in the view. For example, reference lines and bands are available when you edit an axis, and trend lines and forecasts are available from the Analysis menu.
The Analytics pane provides drag-and-drop access for the various options.
On the web, most analytics objects are available from the Analytics pane.
Add an analytics object to the view
To add an item from the Analytics pane, drag it into the view. When you drag an item from the Analytics pane, Tableau shows the possible destinations for that item. The range of choices varies depending on the type of item and the current view.
In a simple case, the drop target area would offer these three options:

The terms Table, Pane, and Cell define the scope for the item:

For a more complicated view—for example, a view with dual axes—Tableau would show you a drop target area that looked like this:

If you dropped the item in one of the three larger boxes in the header at the top of the drop target area—for example, the Table box—a separate median with quartiles would be added for each axis:

But if you drop the item in any of the six lower boxes aligned with a specific measure, the median with quartiles would only be added on the corresponding axis, with the specified scope.
Delete an analytics object from the view
You can delete an analytics object from the view by clicking Undo, or drag the object off the view to delete it.
You can also click an item and select Remove from the tooltip.
Note: Some Analytics pane items (Median with Quartiles and Average with 95% CI) add both a reference line and a reference distribution. Unless you’re using Undo, you would need to delete these items separately.
Edit an analytics object in the view
To edit an item you’ve added from the Analytics pane, click the item and select Edit from the tooltip. For additional editing options, see the section for a particular item type under Analytics object definitions, below.
Analytics object definitions
The following items can be dragged from the Analytics pane and dropped in the view. If an analytics object can’t be applied to the current configuration of fields in the view, it isn't available.
Constant Line
Adds one or more constant lines to the view. You can add a constant line for a specific measure, for all measures, or for date dimensions. When you add a constant line, Tableau shows a Value prompt where you specify the value for the constant:

In Tableau Desktop, the Value prompt for a date value is a calendar control:

You can click a resulting constant line and select Edit or Remove. In Tableau Desktop there’s a third option: Format. Selecting Edit opens the Edit Reference Line dialog box. For details, see Edit Existing Reference Lines, Bands, and Distributions in the Reference Lines, Bands, Distributions, and Boxes article. Another way to edit a line in Tableau Desktop is to right-click (control-click on Mac) the relevant axis and select Edit Reference Line.
Average Line
Adds one or more average lines to the view. You can add an average line for a specific measure or for all measures.
You can click a resulting average line and select a different aggregation, such as Total or Sum. You can also select Edit or Remove. In Tableau Desktop there’s a third option: Format. Selecting Edit opens the Edit Reference Line dialog box. For details, see Edit Existing Reference Lines, Bands, and Distributions in the Reference Lines, Bands, Distributions, and Boxes article. Another way to edit a line in Tableau Desktop is to right-click (control-click on Mac) the relevant axis and select Edit Reference Line.
Median with Quartiles
Adds one or more sets of median lines and distribution bands to the view. You can add a median with quartiles for a specific measure or for all measures.
The distribution bands are computed as quartiles; the middle two quartiles are shaded.
You can click a resulting median line or distribution and select Edit or Remove. In Tableau Desktop there’s a third option: Format. Median lines and distributions must be edited, formatted, or removed separately. Selecting Edit opens the Edit Reference Line dialog box. You must click the outer edge of a distribution band to see the options—clicking in the middle of the band has no effect. For details, see Edit Existing Reference Lines, Bands, and Distributions in the Reference Lines, Bands, Distributions, and Boxes article. Another way to edit a line or distribution in Tableau Desktop is to right-click (control-click on Mac) the relevant axis and select Edit Reference Line. A submenu will offer you two choices: Quartiles and Median.
For information on distribution types, including quartiles, see Add Reference Distributions in the Reference Lines, Bands, Distributions, and Boxes article.
Box Plot
Adds one or more box plots to the view. You can add box plots for a specific measure or for all measures. The scope for a box plot is always Cell (and never Table or Pane).
Click or hover over any of the horizontal lines in the box plot to see statistical information about the whiskers, quartiles, and median.
You can also select Edit or Remove when you click a line. In Tableau Desktop there’s a third option: Format. Selecting Edit opens the Edit Reference Line dialog box. Another way to edit a box plot in Tableau Desktop is to right-click (control-click on Mac) the relevant axis and select Edit Reference Line.
Note: In Tableau Desktop, there are two items named Box Plot in the Analytics pane. For the Box Plot option in the Summarize section, Tableau will automatically add a box plot for the specified target. For the Box Plot option in the Custom section, Tableau will open the dialog after you specify a target.
Totals
Adds totals to the view. When you add totals, the drop options are Subtotals, Column Grand Totals, and Row Grand Totals.
For details, see Show Totals in a Visualization.
To remove totals, click the relevant column or row header and select Remove.
In Tableau Desktop, you can also click a totals column or row header after adding totals and set the aggregation from the tooltip:

Average with 95% CI
Adds one or more sets of average lines with distribution bands; the distribution bands are configured at a 95% confidence interval. You can add these items for a specific measure or for all measures.
The confidence interval distribution bands shade the region in which the population average will fall 95% of the time.
You can click a resulting average line or distribution and select Edit or Remove. In Tableau Desktop there’s a third option: Format. Selecting Edit opens the Edit Reference Line dialog box. The average lines and distributions must be edited, formatted, or removed separately. You must click the outer edge of a distribution band to see the options—clicking in the middle of the band has no effect. Another way to edit a line or distribution in Tableau Desktop is to right-click (control-click on Mac) the relevant axis and select Edit Reference Line. A submenu will offer you two choices: Average and 95% Confidence Interval.
You can also remove lines and bands by dragging them off the view.
Median with 95% CI
Adds one or more sets of median lines with distribution bands; the distribution bands are configured at a 95% confidence interval. You can add these items for a specific measure or for all measures.
The confidence interval distribution bands shade the region in which the population median will fall 95% of the time.
You can click a resulting median line or distribution and select Edit, Format, or Remove. In Tableau Desktop there’s a third option: Format. Selecting Edit opens the Edit Reference Line dialog box. The median lines and distributions must be edited, formatted, or removed separately. You must click the outer edge of a distribution band to see the options—clicking in the middle of the band has no effect. Another way to edit a line or distribution in Tableau Desktop is to right-click (control-click on Mac) the relevant axis and select Edit Reference Line. A submenu will offer you two choices: Median and 95% Confidence Interval.
You can also remove lines and bands by dragging them off the view.
Trend Line
Adds one or more trend lines to the view. When you add trend lines, the drop options identify the trend line model types available in Tableau: Linear, Logarithmic, Exponential, and Polynomial. For some views, only a subset of these options is available.
For details, see Trend Line Model Types .
Click a trend line to remove or edit it, or to see a statistical definition. You can also remove a trend line by dragging it off the view.
Forecast
Adds a forecast to the view. This option is only available in Tableau Desktop—not when you edit a view on the web. Forecasting is only possible when there is at least one measure in the view.
Forecasting is not supported for views based on multidimensional data sources. In addition, the view can’t contain any of the following:
- Table calculations
- Disaggregated measures
- Percent calculations
- Grand Totals or Subtotals
- Date values with aggregation set to Exact Date
A time series containing null values also imposes constraints.
For details, see Forecasting.
To remove, edit, or read a description of the current forecast, go to the Analysis menu and select Forecast.
Custom Reference Line
You can add reference lines for a specific measure or for all measures in the view.
After you drag a reference line from the Analytics pane and drop it on a target, Tableau automatically opens an edit dialog box. See Add a Reference Line in the Reference Lines, Bands, Distributions, and Boxes article for information on the available options. To return to this dialog box later, click the line and select Edit.
Custom Reference Band
You can add reference bands for a specific measure or for all measures in the view.
After you drag a reference band from the Analytics pane and drop it on a target, Tableau automatically opens the dialog box. See Add Reference Bands in the Reference Lines, Bands, Distributions, and Boxes article for information on the available options. To return to this dialog box later, click the band and select Edit. Cclick the outer edge of a reference band to see the options—clicking in the middle of the band has no effect.
Custom Distribution Band
You can add reference distributions for a specific measure or for all measures in the view.
After you drag a reference distribution from the Analytics pane and drop it on a target, Tableau automatically opens the dialog box. See Add Reference Distributions in the Reference Lines, Bands, Distributions, and Boxes article for information on the available options. To return to this dialog box later, click the band and select Edit. Click the outer edge of a distribution band to see the options—clicking in the middle of the band has no effect.
Custom Box Plot
In Tableau Desktop—but not when you edit a view on the web—you can drag a box plot fromthe Analytics pane and drop it on a target. (But keep in mind that on the web, you can add a box plot from the Summarize section on the Analytics pane.) When you drag Box Plot from the Custom section, Tableau automatically opens Edit Reference Line, Band, or Box dialog box. See Add a Box Plot in the Reference Lines, Bands, Distributions, and Boxes article for information on the available options. The scope for a box plot is always Cell (and never Table or Pane).
Click any of the horizontal lines in the box plot to see statistical information about the whiskers, quartiles, and median.
To return to this dialog box later, click the band and select Edit.