Use Dynamic Axis Ranges
It’s key that your users understand the range represented in a viz so that they can correctly analyze the data. Especially when analyzing multiple vizzes in a dashboard or multiple worksheets at the same time, it can be easy for users to misinterpret data when the range of the axes is different between vizzes. For example, when two bar charts appear next to each other, the bars in both charts might appear to be equivalent sizes. However, the axes might have very different ranges, making the charts misleading.
To help users understand the range of the axis, in 2023.3 and later, authors can use Dynamic Axis Ranges to set the minimum and maximum values of an axis range by using numeric parameters or date parameters. Then, as users navigate across vizzes, the axes update synchronously. This makes it easier for your users to analyze data across vizzes easily and accurately. And by limiting the range of the data, you can view a subset of data without filtering the underlying data or impacting the moving average of your data.
Dynamic Axis Ranges can also be used to extend or shorten the range of an axis without filtering out the underlying data. This is ideal for showing progress against a goal or showing a moving average.
Supported field types
Dynamic Axis Ranges support any parameter that is compatible with the selected continuous axis, for example:
- Numeric parameters
- Temporal parameters (date or dateTime)
Configure a dynamic axis range based on selection
Starting in Tableau 25.3, you can automatically update the axis range based on area selection, eliminating the need for separate parameter and parameter action workflows.
-
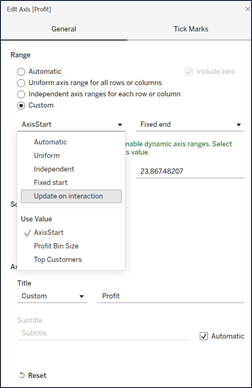
From a worksheet, right-click the axis and choose Edit Axis…
-
For the Range, choose Custom.
-
Expand the dropdown menus, choose Update on interaction for the start and end range points.
-
Close the dialog.
-
Return to your visualization and select an area on the viz to set the corresponding value for the chosen range point.
Configure a dynamic axis range with an existing parameter
You can also configure your dynamic axis range by tying it to an existing parameter.
- From a worksheet, create a parameter for your axis.
- Right-click the axis, and choose Edit Axis.
- For the Range, choose Custom. Then, select the parameter that you created for either the start or end axis extent.
- Close the dialog box.
- If you’re using multiple sheets on a dashboard, repeat these steps for the axes across the different sheets.

Understand limitations and edge cases
Dynamic Axis Ranges aren’t updated within Stories. If the parameter used for the axis is deleted, then the most recent parameter value remains as the axis extent. The next time you edit the axis, an error message will prompt you to choose a new parameter to be used.