Don’t Be Scared of Deeper Relationships
Because of the nature of relationships, understanding where fields come from, their domain, and what nulls represent is more important than ever. Remember that anyone viewing the viz without access to the Data source page or the Data pane will be reliant on the title or other information presented by the author to interpret the viz correctly.
Note: if you aren’t yet comfortable with the principles behind data sources that use relationships, it might help to read Don’t Be Scared of Relationships before diving into this topic.
Why aren’t all date fields equal?
It’s important to remember that just because two field names contains the word “Date” doesn’t mean the contents of those fields are identical. Let’s look at an example that sticks with the level of Year. That is, we don’t care about the values for months and days, we’re only interested in what years the fields cover.
There are multiple fields in The Bookshop Dataset with a data type of Date.
- Birthday
- Publication Date
- Sales Date
- And Year Won and Year Established also contain date information, though they are numeric fields.
- NB: If the icon in the data pane is green, this field is continuous. Right click on the field name in the Data pane and choose Convert to Discrete(Link opens in a new window). The icon should turn blue. Do this for both “Year Won” and “Year Established” if necessary.
But the domain—the values in each field—vary. Bring each field in turn to the rows shelf and look at the number of marks in the bottom left corner, removing each field before bringing out the next.
- YEAR(Birthday) has 27 marks, meaning the domain contains 27 different years.
- YEAR([Publication Date]) has 15 marks, so its domain consists of 15 years.
- Year Won has 11 marks
- Year Established has four marks
- YEAR([Sales Date]) has one mark
This difference in domain is very important to keep in mind. If we related the Edition and Award table on YEAR([Publication Date]) to Year Won, we could wind up with analyses that use an inner join and are therefore trimmed down to just the years when an award was won—thus dropping all books from years without awards. (Note that this is not the same thing as filtering out books without awards. Non-award winning books that were published in the same year as an award-winning book will be preserved. All books from years with no awards will be dropped entirely. The filtering action from the join is at the level of year, not book.)
Example: Publication Date and Birthday
If we bring Publication Date to Columns and Birthday to Rows, we get a table of Abcs. You can download the workbook and explore this table on your own. (Requires Tableau Desktop 2020.2 or later.)
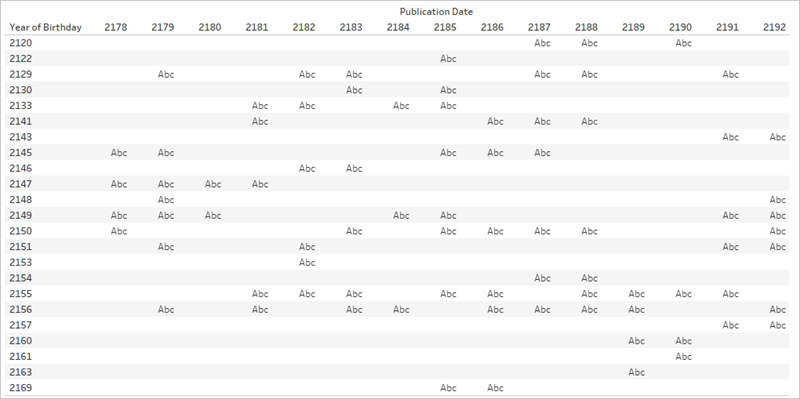
Abc is simply a placeholder because there is no data other than the years. Tableau has no values to make marks with, but the Abc shows where marks could go.
Notice that there is a lot of blank space in this table. There is no placeholder for the Publication year 2180 and the Birthday 2133. This means the author born in 2133 did not publish in the year 2180.
Sure. But why do we care?
Imagine you wanted to do some analysis over time. Are Hardcover sales increasing over time? You might imagine your graph as a timeline that filters Format to only Hardcover with Sales(Count) on Rows and date on Columns. But which date field? Publication Date? Birthday? Sales Date? These fields are well named and it’s fairly obvious that if we have a question about sales we should use Sales Date. Not all data sets have clear names, though. If the fields were something like “Date1” and “Date3” it would be much harder to tell. Especially if the analytical question isn’t clearly thought through.
What table a field comes from and what the domain of the field represents have a crucial impact on analysis.
By changing the date field, we can change the analysis entirely. Consider these two vizzes:
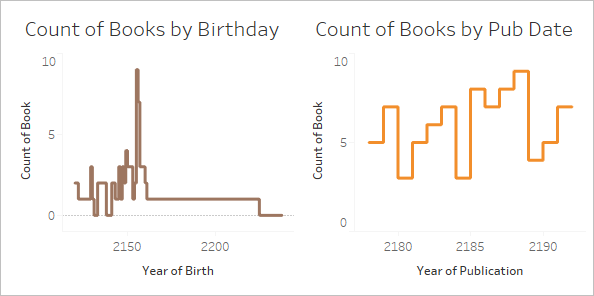
The first could be interpreted as “How many books were written by authors born in each year?”. It answers questions like “Have older authors written more books?” (No) or “Author(s) born in which year are the most prolific?” (2155).
The second could be interpreted as “How many books were published each year?”. It answers questions like “Which year had the most published books?” (2188) or “Is book publication steady over time?” (No).
It’s awkward to phrase the question for the viz that uses birthday because it’s an awkward combination of concepts. But Tableau doesn’t judge and will let you ask whatever question you like—whether you mean to or not. That’s a vital takeaway. If you bring out Date3 when you should have used Date1, Tableau will give you a viz. But not all date fields mean the same thing and it’s up to the author to know which field to use for the correct analysis.
For more information about the importance of what table a field comes from, check out this blog post(Link opens in a new window).
What does missing data mean?
There’s a difference between zero and null.
Zero means we measured and something isn’t there. We know the value and it is zero. If I have zero speeding tickets, I probably don’t speed much.
- NB: 0 and 1 are often used interchangeably with True/False, or other binomial values like Yes/No or Pass/Fail. In this case, zero is being used as a label, not a numeric value.
Null means we don’t know: we haven’t measured or we didn’t record the data. If my driving record is simply blank for speeding tickets, we have no idea if I speed or not.
Nulls can represent either missing data or nonexistent data.
- For my driving record, if the speeding tickets value is null, it’s conceivable that I could have a speeding ticket that wasn’t recorded. We should assume that data is missing.
- Nonexistent data could be recorded as N/A, but is often simply not recorded because we don’t need to track impossible things. How many speeding tickets did I get while riding a bus? That data likely won’t be present in the data set. In a matrix of “Modes of transportation” and “speeding tickets”, there are combinations that simply don’t make sense. We may assume that data is nonexistent.
When nulls carry meaning
It takes knowledge of the data to be able to recognize if a null is truly unknown (lack of information for number of speeding tickets) or if it represents nonexistent data (lack of information about speeding tickets as a bus passenger). Is the data trustworthy enough that a lack of information can be taken as nonexistent data rather than missing data? When subject matter expertise is applied, nulls can be meaningful.
Looking again at the table of Abcs, we can analyze the spaces without placeholders. We’ll assume this data is reliable and a null means the data is nonexistent rather than incomplete.
The lack of a placeholder means an author was born that year (so the row exists), and a book was published that year (so the column exists), but the published book was not written by an author born in that year (so the cell is empty). We can meaningfully assign a label to that empty space: Nothing Published. We could even do analysis on those nulls—for example, for the dates present in the data, how many years went by for each author without publishing a book?
Note: There are also gaps in the domain of Birthdays. No authors were born in 2131 or 2132, so Year goes from 2130 to 2133 (the rows for 2131 and 2132 do not exist). These missing years can be interpreted as “no books in this data set had authors born in those years”. However, as pointed out above when talking about the domain of the date fields, the fact there are missing values in the domain is important information to consider when building relationships or choosing which field to use for a header or axis in a viz.
For more information about working with nulls in relationships, check out this blog post(Link opens in a new window).
Hands-on exercises
Write a title for each viz. Can you describe what is happening in plain language? Download the workbook to explore the live vizzes. (This workbook uses a slightly tweaked version of The Bookshop Dataset and uses only two tables. The date fields have been adjusted so they can be used as the related field.)
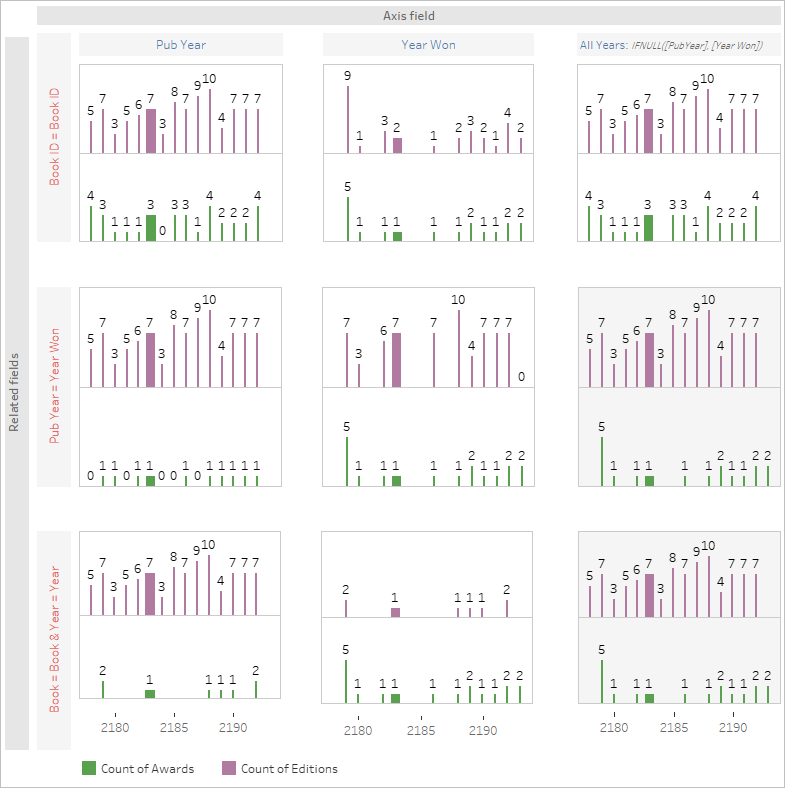
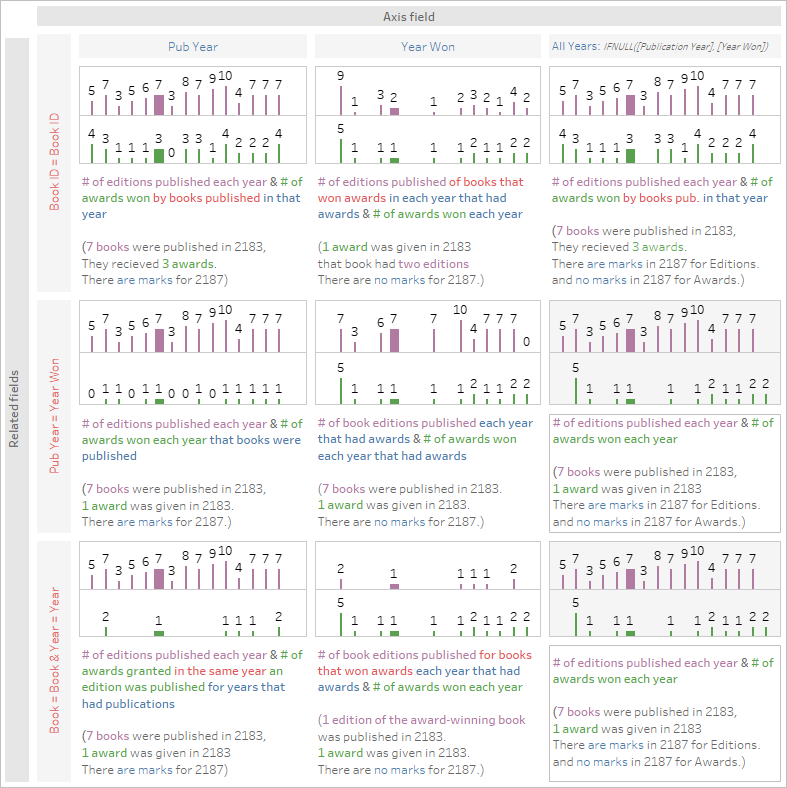
To read the matrix of vizzes:
- The bars show the number of editions (purple) and number of awards (green) per year.
- Each column has a different date field for the axis. The left-hand column is Publication Year from the Edition table, the center column is Year Won from the Award table, and the right-hand column is a calculated field that used publication date but if that field is null uses Year won (this calculation is used to ensure that both domains are fully represented).
- Each row is a different relationship for how the Award and Edition table are combined. The top row relates the tables on Book ID, the middle row relates them on Year, and the bottom row relates them on both Book ID and Year.
- The bars for the year 2183 are thicker to make comparison easier. In the solution below, that is the year whose values are looked at in detail.
- Note that the two vizzes that are shaded have identical values.
If you get stuck
Walk through each part of the viz step-by-step. Look at the data source structure, the axis and headers, and the fields used for the marks (and which tables they come from). Think about nulls and why they might be there. View the data for a specific mark or two to see which records it contains.
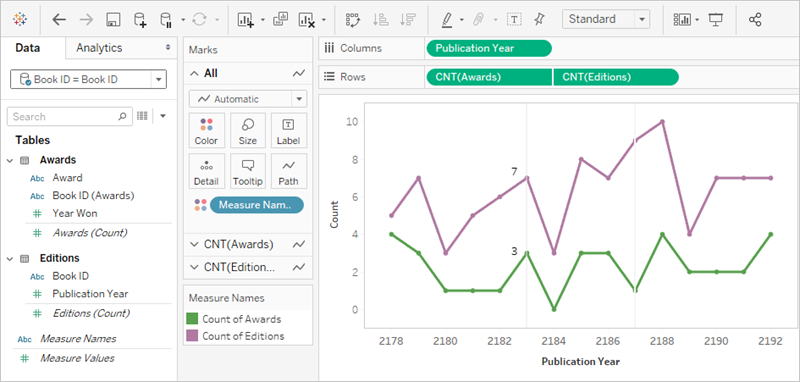
- The data source is Awards related to Editions on Book ID.
- The date axis is Publication Year
- The values are Count of Awards and Count of Editions.
Try to pick a single mark in the viz and define it. For the year 2183, the viz shows there are seven editions and three awards. Use View Underlying Data to investigate which records are represented in each mark.
Editions
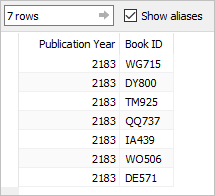
Awards
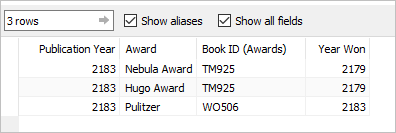
Together, this can be interpreted as “return the seven books published in 2183, then for those books, list any awards they won regardless of when they won the award”. TM925 was originally published in 2179 and the hardcover edition won two awards in that year. In 2183, a different edition of the book was published, perhaps in paperback. The value for Count of Award is tied to the book, not the year.
So the viz overall could be interpreted as “the number of editions published each year, and how many awards were won by books published in that year” or “the number of editions published each year and the number of awards won by those books”.
The year 2183—the thicker bars—is the year focused on for interpretation. Information about editions is in purple and information about awards is in green. The year 2187 is also called out in the descriptions because it is a year when no awards were won but books were published. As such, it is a good illustration of the power of which date field is used for the axis. This nuance is addressed in blue in the description. The importance of the field(s) used to set up the relationship is called out in pink.
This visual is provided for your convenience, but a better experience may be to download the workbook and open it in Tableau Desktop 2020.2 or later so you can make use of interactivity such as tooltips and View Data. If you prefer to look at the sheets more closely, you can right click on either dashboard tab at the bottom and choose Unhide all Sheets. This will make all the individual vizzes available, and from each sheet you can see the Data pane and the authoring environment, including which fields are on which shelves. Note that in order to achieve the three different relationships (the rows of the matrix above), there are three different data sources.
Related resources
Feeling a bit overwhelmed and want to go back a step? Try Don’t Be Scared of Relationships.
Ready to tackle calculations with Relationships? Check out Don’t Be Scared of Calculations in Relationships.
For more information on the technical underpinnings of relationships straight from the Product Management team, check out the series on relationships on the Tableau Blog.
- Relationships, part 1: Introducing new data modeling in Tableau(Link opens in a new window)
- Relationships, part 2: Tips and tricks(Link opens in a new window)
- Relationships, part 3: Asking questions across multiple related tables(Link opens in a new window)
Also see video podcasts on relationships from Action Analytics(Link opens in a new window), such as Why did Tableau Invent Relationships?(Link opens in a new window) Click "Video Podcast" in the Library(Link opens in a new window) to see more.