FIXED Level of Detail Expressions
FIXED level of detail expressions compute a value using the specified dimensions, without reference to the dimensions in the view.
The following examples can be recreated using the Sample - Superstore data source.
Example 1
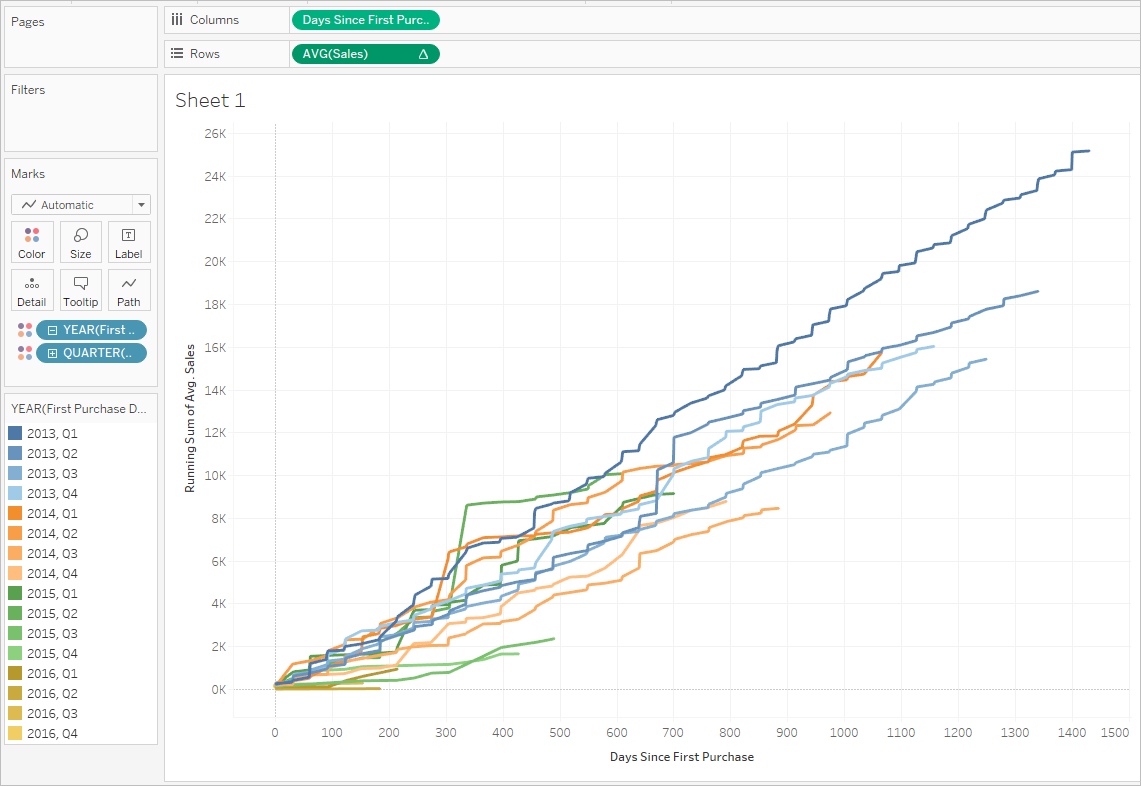
The following view shows the interval between a customer’s first purchase date and any subsequent purchase:

Step-by-Step
Here's how to build the view above, using the Sample - Superstore data source provided with Tableau Desktop.
-
Create two calculated fields: a FIXED level of detail expression, and a date subtraction.
Name Formula First Purchase Date {FIXED [Customer Name] : MIN([Order Date])} Days Since First Purchase DATETRUNC('day', [Order Date])-DATETRUNC('day', [First Purchase Date]) -
Drag Days Since First Purchase from the Measures area of the Data pane to the Dimensions area.
Because this calculated field contains a subtraction operation, the result is a number, and so Tableau assigns it to the measure category. But you will be using it as a dimension.
-
Drag Days Since First Purchase to Columns.
-
Click Days Since First Purchase on Columns and choose Continuous.
-
Drag Sales to Rows.
-
Change the aggregation for Sales on Rows from SUM to AVG.
-
Add a quick table calculation to Sales on Rows: Running Total.
-
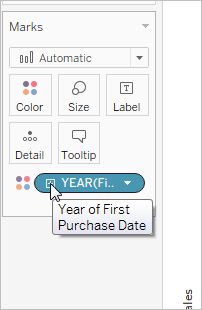
Drag First Purchase Date to Color.
-
Click the + in the YEAR(First Purchase Date) field on Color to add the next level down in the date hierarchy: QUARTER(First Purchase Date).

-
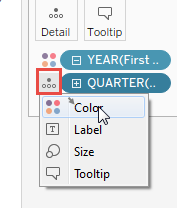
Tableau won't automatically put two fields on Color, but you can make it happen by clicking the icon to the left of the QUARTER(First Purchase Date) field and choosing Color:

-
Drag the Color legend over to the left side of the view, below the Marks card.
Your view should now look like this:

The visualization yields insights as you interact with it. Select individual quarters in the color legend on the left to see how customers acquired in specific individual quarters continued to spend in subsequent quarters. Notice that customers acquired in the early going (2013) tend to spend at a higher rate, even allowing for the fact that they had more time to do so—thus, the blue lines (for 2013) are higher up on the x-axis than other lines. If you had used a standard date value on the y-axis, the view would have been easier to create, but the lines would not all start at the same coordinates and so it would be more difficult to compare acquisition rates.
You can also drag either YEAR(First Purchase Date) or QUARTER(First Purchase Date) off color to see seasonal or annual trends more clearly.
Example 2
The following FIXED level of detail expression computes the sum of sales per region:
{FIXED [Region] : SUM([Sales])}
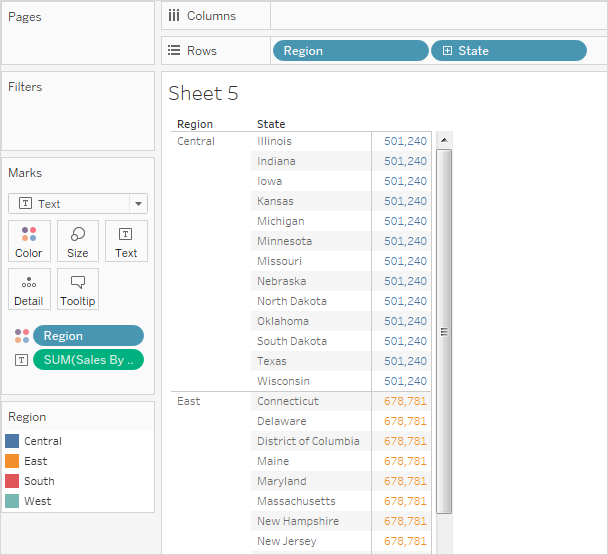
This level of detail expression, named [Sales by Region], is then placed on Text to show total sales per region:

The view level of detail is [Region] plus [State], but because FIXED level of detail expressions do not consider the view level of detail, the calculation only uses the [Region] dimension, and so the values for the individual states in each region are identical. See Level of Detail Expressions and Aggregation for an explanation of why this is so.
If the INCLUDE keyword had been used in the level of detail expression instead of FIXED, the values would be different for each state, because Tableau would add the dimension in the expression ([Region]) with any additional dimensions in the view ([State]) in determining values for the expression. The result would be:

