Pass Expressions with Analytics Extensions
Beginning with version 2021.2, you can create multiple analytics extensions connections for any site. Versions prior to 2021.2 are limited to a single analytics extension for any site.
After you create a connection to an analytic extension, you can communicate with your external service through calculated fields. Each calculated field uses the SCRIPT functions for expressions, operating as a table calculation.
Configure an analytics extension
Tableau allows connections to analytics extensions via a set of SCRIPT functions. Before you can pass any SCRIPT functions to your analytics extension, you need to configure your connection to the service.
In Tableau Desktop, click the Help menu, and then select Settings and Performance > Manage Analytics Extension Connection. Select the analytics extension you want to connect to. MATLAB connections are managed by the Analytics Extension API.

Select and configure your analytics service.
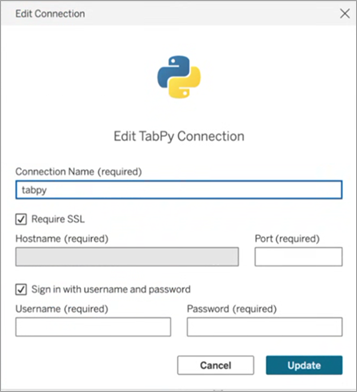
If you are using Einstein Discovery, select Enable. Your default browser will open, allowing you to authorise the connection to Salesforce. After connecting, go to the Einstein Discovery section of this help topic to continue. For all other services (Tabpy, Matlab and RServe), the following dialog will appear. 

Enter or select a server name using a domain or an IP address.
If your server is using SSL encryption, select the Require SSL option. Tableau will read certificates installed in the operating system key store to establish the secured connection.
Note: Tableau only supports PEM encoded certificates when connecting to TabPy or RServe.
- Specify a port.
- Port 6311 is the default port for plaintext RServe servers.
- Port 4912 is the default port for SSL-encrypted RServe servers.
- Port 9004 is the default port for TabPy.
- Click Test Connection.
- Click Save.
If no connection can be established, an error message is displayed. Click Show Details in the message to see any diagnostic information returned by the server.
Configure Analytics Extensions in Web Authoring
When using Tableau Cloud web authoring, select Analysis > Analytics Extension > Manage Connection....
Select which type of connection you want to make, then fill in the required connection information.

- For Tableau Server, see "Configure Connection with Analytics Extension" (Windows(Link opens in a new window) | Linux(Link opens in a new window)).
Use Analytics Extensions in Web Authoring
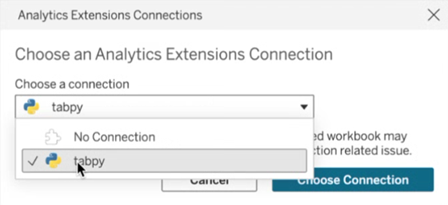
To use an analytics extension, select Analysis > Analytics Extension > Custom Functions Explorer... then choose the analytics extension you want to use for the workbook. Only one analytics extension can be used per workbook.

SCRIPT functions for expressions
A series of four SCRIPT functions are available for passing expressions to analytics extensions and obtaining a result. The functions are:
SCRIPT_BOOLSCRIPT_INTSCRIPT_REALSCRIPT_STR
See SCRIPT_ functions for details and examples.
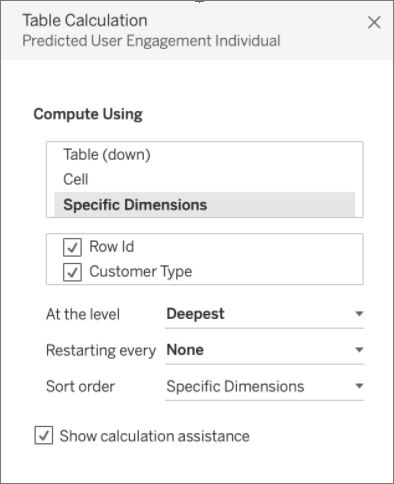
Because connecting to an analytics extension involves some network overhead, it is often most efficient to pass data all at once rather than as individual row values whenever possible. For example if you set addressing to Cell (for example, by clicking the field in the view and choosing Compute Along > Cell), Tableau will make a separate call per row (created by each mark in the visualisation) to the analytics extension. Depending on the size of the data, this can result in a very large number of individual calls.
The easiest way to ensure efficient calls are made to the analytics extension is to navigate to Edit Table Calculation and select Specific Dimensions then check the box next to each dimension to put that dimension on addressing. This will generate a single analytics extension call for the entire visualisation. Any dimension left unticked will be partitioned on, generating a separate call for each member in the visualisation. If there are many marks in the visualisation, it may be advantageous to select Pause Auto Updates while selecting dimensions to prevent frequent runs of the calculation before it is properly computed.

Directly query external analytics models
A series of four functions can directly query a deployed model in your analytics extension. This can keep you from having to write lengthy calculations into a script function. Collectively, these are known as the MODEL_EXTENSION functions, and just like the above-mentioned Script functions, there are four iterations:
MODEL_EXTENSION_BOOLMODEL_EXTENSION_INTMODEL_EXTENSION_REALMODEL_EXTENSION_STR
The four functions differ only by what values they return. A MODEL_EXTENSION_BOOL function returns a Boolean value, for example. In order to use the MODEL_EXTENSION functions, you need to have a deployed model in your external analytics service, and the external analytics service must allow for direct queries of that model.
Note: Currently, only TabPy models support MODEL_EXTENSION functions.
Parts of the MODEL_EXTENSION function

See Table Calculation Functions for details and examples.
Because these SCRIPT functions are table calculations, addressing and partitioning concepts apply. (For an explanation of these concepts, see The basics: addressing and partitioning.) Tableau makes one call to an the analytics extension per partition. This means that for each dimension the calculation is partitioning on, one call will be made for every member of that dimension present in the visualisation. For this reason, it is recommended to put dimensions on addressing unless partitioning is necessary.
TabPy
Python is a widely used high-level programming language for general-purpose programming. By sending Python commands to an analytics extension, you can do things like predicting customer churn or running sentiment analysis.
Tableau Python Server (TabPy) is part of Tableau's expanding range of extensibility options. To install TabPy, visit this GitHub page(Link opens in a new window). To read more about the possibilities of Python in Tableau, see Building advanced-analytics applications with TabPy(Link opens in a new window).
Custom Functions Explorer for deployed models
Deployed models can contain schema information that includes a description, the type of arguments they take, what their output is and similar documentation. The Custom Function Explorer can read that schema and provide point-in-time documentation for those using the model.
For example, a deployed model translateToEnglish may look like this:
"translateToEnglish": {
			"description": "Translates a given input to English",
			"type": "model",
			"version": 2,
			"dependencies": [],
			"target": null,
			"creation_time": 1726765000,
			"last_modified_time": 1726777904,
			"schema": "{'input': {'type': 'object',
				'properties': {'phrase': {'type': 'string', 'description': 'phrase which we would like to translate'}},
				'required': ['phrase']},
				'sample': {'phrase': 'Danke'},
				'output': {'type': 'string', 'description': 'translated phrase'}}",
		"is_public": true
The Custom Functions Explorer displays that information and shows the user exactly what the model is for and what needs to be updated to bring in their data.

Use the Custom Functions Explorer
You may need to perform some or all of these steps, depending on your current configuration:
- Deploy a TabPy server. See the TabPy documentation on GitHub(Link opens in a new window) for details.
Note: Custom functions explorer requires TabPy version 2.12.2 or later. To update your TabPy version, refer to the GitHub documentation(Link opens in a new window).
- Start a TabPy server with a deployed model.
- In Tableau, turn on the Analytics Extension Connection.
- In Tableau Desktop: Help menu > Settings and Performance > Manage Analytics Extension Connection…
- On the web: Analysis menu > Analytics Extensions > Custom Functions Explorer
- Enter the Hostname and Port.
Once you're in a workbook with a data connection and Analytics Extensions connected to a running TabPy instance, you can use the Custom Functions Explorer:
- On a worksheet with the data source already connected, go to the Analysis menu > Analytics Extension Custom Functions Explorer (on the web, Analysis > Analytics Extensions > Custom Functions Explorer...).
- Select the one you want and click the Copy to Clipboard button.
- Only models with the parameter
is_public=Trueappear in the list. This parameter is False by default. Models whereis_public=Falseis still available to use as model extension calculations just don't appear in the Custom Functions Explorer. - If the Custom Functions Explorer appears empty or is missing a deployed model you want to use, verify
is_publicis set to True for the deployed model. See the TabPy documentation on GitHub(Link opens in a new window) for details. - If a deployed model doesn't have a schema, the Custom Functions Explorer is less useful but still has the Copy to Clipboard option.
- Create a new calculation and, for the function, paste in the syntax copied to clipboard.
- Replace any InputField placeholder with the field in your data source you'd like to use in the model.
- Note that as for all table calcs, you'll need to aggregate the input. For strings, MIN, MAX and ATTR are possible aggregations.
Einstein Discovery is a powerful analytics tool in Salesforce that makes use of machine learning to provide insights and predictions. Einstein Discovery requires the Einstein Analytics Plus licence, Tableau CRM Plus licence, or the Einstein Predictions licence, which are available for an extra cost. For related information, see Requirements for access.
For more information about Einstein Discovery, see Getting Started with Discovery(Link opens in a new window), and Explain, Predict and Take Action with Einstein Discovery(Link opens in a new window) in Salesforce help. You can also expand your knowledge with the Gain Insight with Einstein Discovery(Link opens in a new window) trail in Trailhead(Link opens in a new window).
Note: Einstein Discovery in Tableau is powered by salesforce.com(Link opens in a new window). Consult your agreement with salesforce.com(Link opens in a new window) for applicable terms.
Integrate Einstein Discovery models into Tableau
With Tableau connected to the Einstein Discovery analytics extension, you can embed predictions directly in calculated fields and Tableau Table Extensions. In Salesforce, use Model Manager to auto-generate a Tableau table calculation script, and then paste that script into a calculated field for use in a Tableau workbook. The table calculation script accesses predictive models deployed in Salesforce by calling the prediction ID and passing the data required for the model.
Note: You can optionally include additional parameters in the script that has been generated by Model Manager for use with table calculations or Tableau Table Extensions. For more information, see Add optional parameters to the script generated by Model Manager.
Embed a prediction in a calculation
Open your Einstein Discovery Salesforce account and navigate to the Model Manager. Select a model to integrate into Tableau. On the model tab, select Edit Settings > Create Tableau Table Calculation.

Model Manager generates a script containing the ID of the prediction definition you want to use, the fields (variables) used in the model, and the corresponding source fields in Tableau.

Click Copy to Clipboard.
In a Tableau workbook, select Analysis > Create Calculated Field, and then paste the generated script in the Calculation Editor.
Replace the fields names inside each ATTR or SUM function with the name of the matching field in your Tableau data, then save the calculated field.

The calculation can be used just like any other Tableau calculation. For more information, see SCRIPT functions for expressions below.
When the script runs, it sends a prediction request (with the input data) to the prediction definition in Salesforce. Einstein Discovery returns the results to Tableau, where it appears in your worksheet or dashboard.
Embed a prediction in a Tableau Table Extension
The script generated by Model Manager can also be used to create a Tableau Table Extension. To use a script generated by Model Manager for a table extension, remove the SCRIPT_REAL portion of the script and include only the request body that is contained in the curly brackets.
Add optional parameters to the script generated by Model Manager
You can optionally include additional parameters in the script that has been generated by Model Manager. These parameters are completely optional; the script will work with or without them. These optional parameters can be used with either a calculated field or with a table extension.
| Optional Parameters | Syntax | Description |
|---|---|---|
| maxMiddleValues | "maxMiddleValues": integer | Specifies the number of top predictors to return in the response. Set to an integer number. Can only be used with Regression and Binary Classification Models. |
| maxPrescriptions | "maxPrescriptions": integer | Specifies the maximum number of improvements to return in the response. Set to an integer number. Can only be used with Regression and Binary Classification Models. |
| showMultiClassProbabilities | "showMultiClassProbabilities": boolean | Choose whether to show the probabilities for a Multi-class Classification Model. Set to true or false. Can be only be used with Multi-class Classification Models. |
The following example script shows how you might use these optional parameters in a script for a calculated field.
SCRIPT_REAL(
'{ "modelOrPredictionDefinitionId": "1ORB0000000HC3KOAW",
"columns": ["Postal_Code", "City", "Ship_Mode", "Row_ID", "Profit", "Category", "Sub_Category", "Order_Date",
     "Quantity", "Ship_Date", "Region", "Sales", "State", "Segment"],
"maxMiddleValues": 3,
"maxPrescriptions": 5,
"showMultiClassProbabilities": false }',
SUM([Postal Code]), ATTR([City]), ATTR([Ship Mode]), SUM([Row ID]), SUM([Profit]), ATTR([Category]), ATTR([Sub-Category]),
     ATTR([Order Date]), SUM([Quantity]), ATTR([Ship Date]), ATTR([Region]), SUM([Sales]), ATTR([State]), ATTR([Segment])
)

The next example shows use of this script with a table extension. For a table extension, include only the script in the curly brackets. Don't include the SCRIPT_REAL function and attributes outside of the curly brackets.
{
"modelOrPredictionDefinitionId": "1ORB0000000HC3KOAW",
"columns": ["Postal_Code", "City", "Ship_Mode", "Row_ID", "Profit", "Category", "Sub_Category", "Order_Date",
     "Quantity", "Ship_Date", "Region", "Sales", "State", "Segment"],
"maxMiddleValues": 3,
"maxPrescriptions": 5,
"showMultiClassProbabilities": false
}
RServe
R is an open source software programming language and a software environment for statistical computing and graphics.
Implementing RServe connections
Tableau Desktop can connect to R via either plaintext or SSL-encrypted traffic. For direction on which type to use, consult your system administrator.
Note: For R integration, Tableau has been tested with R versions 3.4.4 through 3.5.1, and with RServe versions 0.6-8 through 1.7.3.
Intermediate certificate chain for RServe analytics extension
Note: Users don't have to use Tableau Server to connect Tableau Desktop to RServe.
You must install a full certificate chain on Tableau Desktop computers (Windows and Mac) that are connecting to a Rserve external connection through Tableau Server. This requirement is due to how Rserve manages the handshake on secure connections.
Importing a root certificate on the Tableau Desktop is not sufficient, the entire certificate chain must be imported onto the client computer.
MATLAB
MATLAB is a high-level language that connects through the Analytics Extension API that enables you to perform computationally intensive tasks faster than with traditional programming languages such as C, C++ and Fortran. You can use MATLAB in a wide range of applications, including signal and image processing, communications, control design, test and measurement, financial modeling and analysis, and computational biology. For information on how to configure your MATLAB server to work with Tableau please contact MATLAB support.
To read more about the possibilities of MATLAB in Tableau, see Put your MATLAB models and algorithms to work in Tableau(Link opens in a new window).
Share a workbook that requires an analytics extension connection
You might need to send a workbook that contains analytics extension functionality to other users, who may be using different copies of Tableau Desktop on other computers. Or, users may download a workbook from Tableau Server that contains analytics extension functionality. If you share your workbook with someone, they must configure analytics extension connections on their computers.
Publish a workbook that requires an analytics extension connection
- For Tableau Server, see "Configure Connection with Analytics Extension" (Windows(Link opens in a new window) | Linux(Link opens in a new window)).
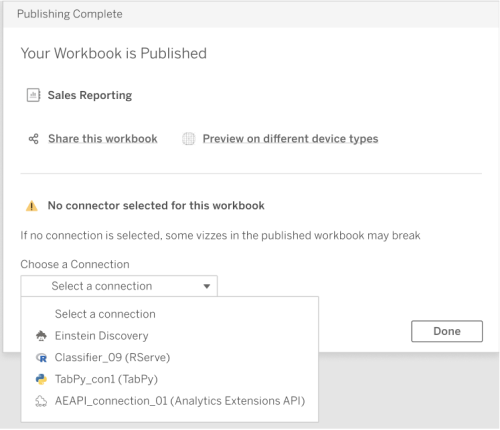
Upon successfully publishing, you must select which of the configured analytics extensions to associate with the workbook.

