Resolve Errors in Predictive Modelling Functions
When using predictive modelling functions in Tableau, you may encounter errors when trying to add the calculations to a viz. Often, this is due to the combination of predictors and visualised elements, leading to a mathematically invalid computation.
Generally, the first thing to try is to double check your Compute Using dimension. Next, verify there isn't a mismatch between the level of detail specified in your predictors and the level of detail in the view. Also verify that your predictors provide relevant data to the model, given the current visualisation.
In this article, we describe several common issues in detail, and the ways in which you can address them.
Errors with predictive modelling functions are usually caused by one or more of the following issues, depending on the model used.
General errors
- Invalid Compute Using dimension
- Dimension predictors conflict with level of detail visualised
- Multiple predictors conflict with each other
- There's not enough data to build a model
- A successful model couldn't be constructed from the data provided
Gaussian process regression errors
- Gaussian process regression requires exactly one ordered dimension predictor
- Gaussian process regression only supports dimensions as predictors
- There's no training data for one or more prediction targets
- There are more than 5,000 marks
Invalid Compute Using dimension
When visualising a predictive modelling function, a Compute Using dimension must be specified. It’s recommended that you select a specific dimension (such as Region or Category) rather than a directional dimension (such as Table Across Then Down or Pane Across).
Since you may have multiple predictive modelling functions included in a viz or dashboard, selecting a specific partitioning dimension will help ensure you’re building models using the same underlying data set for each individual function – in other words, comparing results from like to like models.
For more information on addressing and partitioning, see Transform Values with Table Calculations.
When working with predictive modelling functions, you must ensure you maintain consistency across the different instantiations, both in different iterations of your model (e.g. as you select different predictors), and in different vizzes. Using the directional Compute Using dimensions opens up the possibility that a trivial change in your visualised data will significantly affect the data being used to build the model, thus affecting its validity and consistency across different vizzes.
You may see null values if no Compute Using dimension has been specified, or if an invalid Compute Using dimension has been selected.
Invalid Compute Using dimensions include:
- Cell: This dimension will always result in a single data point being used to build a model and will not be successful.
- A higher-level nested dimension (e.g. if Region and State are both visualised on an axis, where marks are generated for State but grouped by Region.) If Region is selected as the partitioning dimension, it will return null values, since there are no marks formalised for Region in this view.
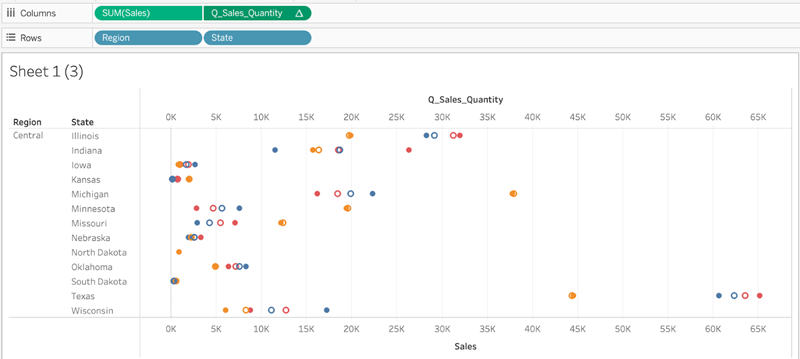
In the above viz, valid Compute Using dimensions are State and Category. Partitioning the data by State or by Category yields multiple valid marks that can be used to build a model.
Region, while listed as a Compute Using option, doesn’t generate any marks on this view's level of detail, and can’t be used to partition the data.
For more information, see Compute Using and Data Partitioning in Predictive Modelling.
Dimension predictors conflict with level of detail visualised
Dimension predictors must be at the same level of detail being visualised or higher. That is, if you’re visualising data by State, you can use State, Region or Country as predictors, but using City as a predictor will cause an error. Since multiple cities exist within a state, this predictor will resolve to * for all marks and won’t return meaningful information; as such, Tableau ignores it.
Each dimensional predictor must be enclosed within an ATTR function, for example:
MODEL_PERCENTILE(SUM([Sales]), ATTR([State]), ATTR([Category])
Multiple predictors conflict with each other
Each predictor used within a given predictive modelling function must provide independent information to the calculation. If two predictors are selected that are exactly equivalent, scaled versions or inverses of each other, the predictive modelling function will return an error when it's visualised.
For example, a data set that tracks weather conditions over time might have two fields: IsRain and IsClear. These two fields are inverses of each other; that is, IsClear = True when IsRain = False, and vice versa. Including both IsClear and IsRain as predictors on a single predictive modelling function will return an error.
The above is true for both measures and dimensions as predictors.
In both cases, the error can be resolved by modifying your predictors to remove the highly correlated predictors. For more information, see Choosing Predictors.
There's not enough data to build a model
There must be at least three marks within a partition to allow predictive modelling functions to build a model and generate predictions. If there are two or fewer marks in the data set defined by the viewed data and the Compute Using dimension, then the predictive modelling function will return null results.
To resolve this issue, revise your level of detail, your data filtering parameters or your Compute Using dimension, so that each partition has more than two marks.
A successful model couldn't be constructed from the data provided
This error appears if there’s a conflict between the predictor(s) selected, the visualised level of detail and/or the selected Compute Using dimension, such that it is impossible to use the predictors to build a rational model.
For example, let’s look at this MODEL_QUANTILE calculation:
MODEL_QUANTILE(0.5, MEDIAN([Profit]), ATTR(MONTH([Order Date])))
Applying this calculation to a viz where each mark represents a State value will return the below error:
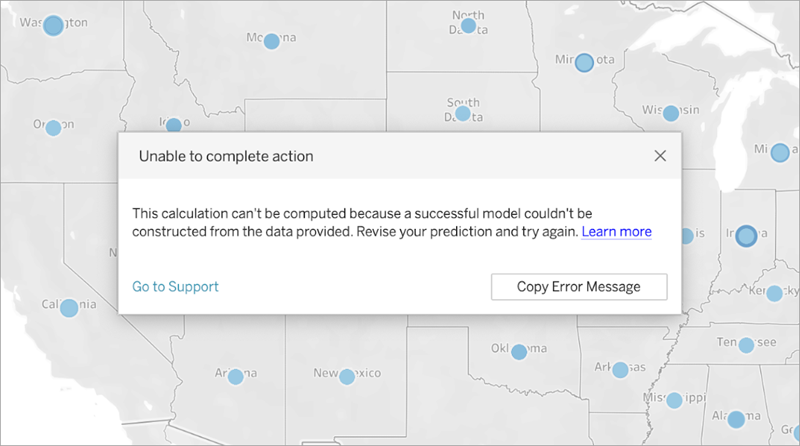
Since Order Date is not used to visualise or segment the data, the predictive modelling function can’t use the predictor specified to build a model.
To resolve this:
- Update your visualisation to include the predictor as a dimension.
- Update your function to remove the non-viable predictor.
It’s worth noting that this error reflects a mismatch between the visualisation and the table calculation's specific predictors. This same calculation would work without issue if applied to a visualisation that included Order Date as a dimension.
Gaussian process regression requires exactly one ordered dimension predictor
To use Gaussian process regression, you must include exactly one ordered dimension as a predictor. You can include additional unordered dimensions as predictors. Measures can't be used as predictors with Gaussian process regression.
If you encounter this error, add an ordered dimension predictor to your table calculation, remove the excess ordered dimension predictor, or specify that one of the ordered dimensions should be treated as an unordered dimension.
As Gaussian process regression is best used on time-series data, this will usually take the form of a time-based predictor such as ATTR(DATETRUNC('month',[Order Date])). Any date_part can be used in the DATETRUNC expression, but the date_part must be at the same or higher level of detail as the viz. That is, if the viz uses WEEK([Order Date]) as the level of aggregation, the date_part must be 'week','month','quarter', etc.; it can't be 'dayofyear', 'day', 'weekday', 'hour', etc.
Note that because ATTR(MONTH([Date])) returns string values, it will not function as an ordered dimensional predictor unless it is manually specified. This is done by including "ordered" immediately before the predictor, as below:
MODEL_PERCENTILE(

"model=gp",

SUM([Sales]),

"ordered",ATTR(MONTH([Order Date]))

)
If you want to include multiple time dimensions in your predictors, you must specify which ones you wish to use as unordered dimensions. This can be done by including "unordered" directly before that dimension, as below:
MODEL_PERCENTILE(

"model=gp",

SUM([Sales]),

ATTR(DATETRUNC('month',[Order Date]))

"unordered",ATTR(DATETRUNC('year',[Order Date]))

)
Attempting to use the above calculation without specifying "unordered" in front of ATTR(DATETRUNC('year',[Order Date]) will return an error.
Additionally, the addressing direction (or ‘Compute Using’) for Gaussian process regression must be set to the same field as the ordered dimension predictor.
Only one addressing direction (or ‘Compute Using’) can be selected for all models.
Gaussian process regression only supports dimensions as predictors
You can't use any measures as predictors in Gaussian process calculations. Remove the measure predictor.
This limitation only applies to predictive modelling functions that specify Gaussian process regression. Linear regression (or OLS, the default) and regularised linear regression functions both support measures as predictors.
There's no training data for one or more prediction targets
Gaussian process regression requires that each data partition has at least n data points in order to build a predictive model and return predictions. If you encounter this error, revise your predictions.
There are more than 5,000 marks
Gaussian process regressions are only supported on vizzes with fewer than 5,000 marks. To resolve this issue, update your level of detail to decrease the number of marks, or select a different statistical model.