Configure Forecast Options
Use the Forecast Options dialog box to configure forecast options, including:
The length of the forecast
The range and temporal aggregation of source data from which to generate the forecast
The forecast model
Prediction intervals
When forecasting is enabled, you can open the Forecast Options dialog box by choosing Analysis > Forecast > Forecast Options.
Forecast Length
The Forecast Length section determines how far into the future the forecast extends. Select one of the following:
Automatic: Tableau determines the forecast length based on the data.
Exactly: Extends the forecast for the specified number of units.
Until: Extends the forecast to the specified point in the future.
Source Data
Use the Source Data section to specify.
Aggregate by: Specifies the temporal granularity of the time series. With the default value (Automatic), Tableau chooses the best granularity for estimation. This will typically match the temporal granularity of the visualisation (that is, the date dimension that the forecast is based on). However, it is sometimes possible and desirable to estimate the forecast model at a finer granularity than the visualisation when the time series in the visualisation is too short to allow estimation.
Note: When you are using an integer dimension instead of a date dimension for forecasting, the Aggregate by value is always Periods. See Forecasting When No Date is in the View.
Ignore last: Specifies the number of periods at the end of the actual data that should be ignored in estimating the forecast model. Forecast data is used instead of actual data for these time periods. Use this feature to trim off unreliable or partial trailing periods which could mislead the forecast. When the estimation granularity specified in the Source Data section is finer than in the visualisation, the trimmed periods are estimation periods. As a result, the trailing actual visualisation period may become a forecast period, which is an aggregate of both actual and forecast periods of estimation granularity. In contrast, null values are not filled with zeros and must be filtered to allow forecast.
Fill in missing values with zeros: If there are missing values in the measure you are attempting to forecast, you can specify that Tableau fill in these missing values with zero.
Forecast Model
The Forecast Model section specifies how the forecast model is to be produced.
Use the drop down to specify whether Tableau selects what it determines to be the best of all models (Automatic), the best of those with no seasonal component (Automatic without seasonality), or the model you specify (Custom).
When you choose the Custom option, two new fields appear in the Forecast Options dialog box, which you use to specify the trend and season characteristics for your model:

The choices are the same for both fields:
None: When you select None for Trend, the model does not assess the data for trend. When you select None for Season, the model does not assess the data for seasonality.
Additive: An additive model is one in which the combined effect of several independent factors is the sum of the isolated effects of each factor. You can assess the data in your view for additive trend, additive seasonality, or both.
Multiplicative : A multiplicative model is one in which the combined effect of several independent factors is the product of the isolated effects of each factor. You can assess the data in your view for multiplicative trend, multiplicative seasonality, or both.
If there is more than one time series in your visualisation, the Custom option forces them all to be forecast using the same custom model. Constraining the models in this way usually results in lower quality models than would be produced by automatic model selection.
Constraints on Multiplicative Models
You cannot use a multiplicative model when the measure to be forecast has one or more values that are less than or equal to zero, or even when some of the data points are too close to zero, relative to other data points.
You cannot specify a model with multiplicative trend and additive season because the result may be numerically unstable.
Prediction Interval
You can set the prediction interval to 90, 95, or 99 percent, or enter a custom value. This value is used in two locations:
In the prediction bands displayed with a forecast.
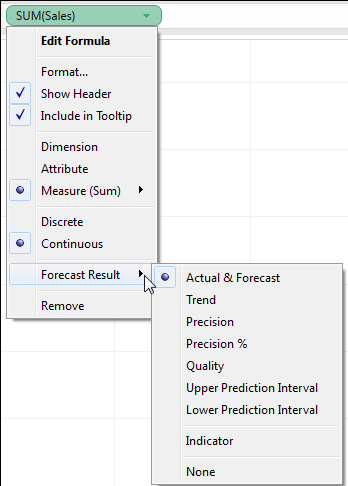
For the prediction interval options (Upper Prediction Interval and Lower Prediction Interval) that are available as forecast result types for a measure in the view:
Forecast Summary
The text box at the bottom of the Forecast Options dialog box provides a description of the current forecast. The forecast summary updates whenever you change any of the forecast options above. If there is a problem with the forecast, the text box provides an error message that may help you resolve the issue. See Resolving Forecasting Errors.