Forecast Field Results
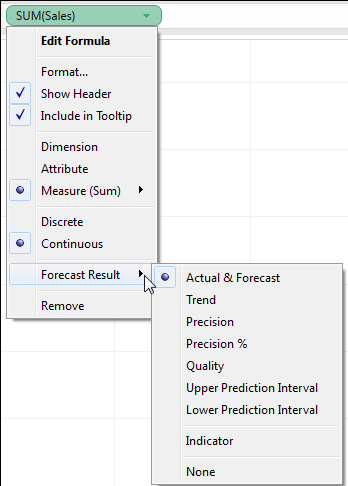
Tableau provides several types of forecast results. To view these result types in the view, right-click (control-click on Mac) on the measure field, choose Forecast Result, and then choose one of the options.
The options are:
Actual & Forecast – Show the actual data extended by forecasted data.
Trend – Show the forecast value with the seasonal component removed.
Precision – Show the prediction interval distance from the forecast value for the configured confidence level.
Precision % – Show precision as a percentage of the forecast value.
Quality – Show the quality of the forecast, on a scale of 0 (worst) to 100 (best). This metric is scaled MASE, based on the MASE (Mean Absolute Scaled Error) of the forecast, which is the ratio of forecast error to the errors of a naïve forecast which assumes that the value of the current period will be the same as the value of the next period. The actual equation used for quality is:
100 * MAX(1 - MASE, 0)
The quality for a naïve forecast would be 0. The advantage of the MASE metric over the more common MAPE is that MASE is defined for time series which contain zero, whereas MAPE is not. In addition, MASE weights errors equally while MAPE weights positive and/or extreme errors more heavily.
Upper Prediction Interval – Shows 90, 95 or 99 confidence level above the forecast value (that is, if the confidence level is 90, the true future value will be above the upper prediction interval 10% of the time), assuming a high-quality model. The confidence level percentage is controlled by the Prediction Interval setting in the Forecast Options dialog box. See Configure Forecast Options.
Lower Prediction Interval – Shows 90, 95, or 99 confidence level below the forecast value. The actual interval is controlled by the Prediction Interval setting in the Forecast Options dialog box.
Indicator – Show the string Actual for rows that were already on the worksheet when forecasting was inactive and Estimate for rows that were added when forecasting was activated.
None – Do not show forecast data for this measure.
Forecast description information is also included in the worksheet description. See Get Details About Fields and Sheets in a Workbook.
Forecasting a New Measure
When you add a new measure to a visualisation that already has forecasting enabled, Tableau attempts to forecast future values.
Changing the Forecast Result Type
To change the forecast result type for a measure, right-click (control-click on Mac) on the measure field, select Forecast Result, and then choose a result type.