Table Calculation Types
This article describes the types of table calculations available in Tableau and when to use them. It uses simple examples to demonstrate how each calculation transforms data in a table. For more information on how to create and configure table calculations, see Create a table calculation.
Difference From calculation
A Difference From table calculation computes the difference between the current value and another value in the table for each mark in the visualisation.
With a Difference From, Percent Difference From, or Percent From calculation, there are always two values to consider: the current value, and the value from which the difference should be calculated. In most cases, you want to calculate the difference between the current value and the previous value. But in some cases you may want something different.
To specify from which value the difference should be calculated:
Right-click a measure in the view and select Add Table Calculation.
In the Table Calculation dialog box, for Relative to, select one of these options:
Previous Calculates the difference between the current value and the previous value in the partition. This is the default value. Next Calculates the difference between the current value and the next value in the partition. First Calculates the difference between the current value and the first value in the partition. Last Calculates the difference between the current value and the last value in the partition.
Example
Consider this text table. It shows the total sales per month for four years for a large store chain.

Use a Difference From table calculation to calculate how sales fluctuate (how much they go up or down) between the years for each month.

You can see that in January, there was a $3,944 difference between sales in 2022 and 2023.
Tip: When calculating year-over-year growth, the first year doesn't have a previous year to compare to, so the column is left blank. Hide the column that you don’t want to show to keep the calculation intact. For details, see Hide rows and columns.
Why? If you filtered out the first year to remove it from the view, it’s removed from the calculation. Then the second year doesn’t have a previous year to compare to and it’s left blank. Instead of filtering, hiding the column keeps the calculation intact.
Moving calculation
For each mark in the view, a Moving Calculation (or rolling) table calculation determines the value for a mark in the view by aggregating across a specified number of values around the current value.
A moving calculation is typically used to smooth short-term fluctuations in your data so that you can see long-term trends. For example, securities data has so many fluctuations every day that it’s hard to see the larger trends through all the ups and downs. You can use a moving calculation to define a range of values to summarise using an aggregation of your choice.
Example
Consider this text table. It shows the total sales per month for four years for a large store chain.
Use a Moving calculation to find out how sales are trending over time. To do this, you can transform each monthly total so that it averages the monthly total for it and the two previous months over time.

You can see the average sales over time. For example, the value listed for December 2024 is the average sales for October, November and December, 2024. The value listed for January, 2025 is the average sales for November and December, 2025 and January, 2025.
Add Secondary Calculation
With Running Total and Moving Calculation table calculations, you have the option to transform values twice to obtain the result you want – that is, to add a secondary table calculation on top of the primary table calculation. For example, you could add an initial table calculation to calculate the running total for sales per month within each individual year, and then a secondary calculation to calculate the year-over-year percent difference for each month from one year to the next.
For an example showing how to create a secondary calculation, see Running Total calculation.
Percent Difference From calculation
A Percent Difference From table calculation computes the difference between the current value and another value as a percentage for each mark in the visualisation.
With a Difference From, Percent Difference From, or Percent From calculation, there are always two values to consider: the current value, and the value from which the difference should be calculated. In most cases, you want to calculate the difference between the current value and the previous value. But in some cases you may want something different.
To specify from which value the difference should be calculated:
Right-click a measure in the view and select Add Table Calculation.
In the Table Calculation dialog box, for Relative to, select one of these options:
Previous Calculates the difference between the current value and the previous value in the partition. This is the default value. Next Calculates the difference between the current value and the next value in the partition. First Calculates the difference between the current value and the first value in the partition. Last Calculates the difference between the current value and the last value in the partition.
Example
Consider this text table. It shows the total sales per month for four years for a large store chain.
Use a Percent Difference From table calculation to calculate how sales fluctuate (how much they go up or down) between the years for each month. Values are calculated as percentages.

In 2022, between January and February there was a -69% difference in sales, but between February and March, there was an improvement of 1,160%.
Percent From calculation
A Percent From table calculation computes a value as a percentage of some other value – typically, as a percentage of the previous value in the table – for each mark in the visualisation.
With a Difference From, Percent Difference From, or Percent From calculation, there are always two values to consider: the current value, and the value from which the difference should be calculated. In most cases, you want to calculate the difference between the current value and the previous value. But in some cases you may want something different.
To specify from which value the difference should be calculated:
Right-click a measure in the view and select Add Table Calculation.
In the Table Calculation dialog box, for Relative to, select one of these options:
Previous Calculates the difference between the current value and the previous value in the partition. This is the default value. Next Calculates the difference between the current value and the next value in the partition. First Calculates the difference between the current value and the first value in the partition. Last Calculates the difference between the current value and the last value in the partition.
Example
Consider this text table. It shows the total sales per month for four years for a large store chain.
Use a Percent From table calculation to calculate the percentage of a previous value.

For 2022, February made 31% of the sales in January; March made 1,260% of the sales in February, and so on.
Percent of Total calculation
For each mark in the view, a Percent of Total table calculation computes a value as a percentage of all values in the current partition.
Example
Consider this text table. It shows the total sales per month for four years for a large store chain.
Use a Percent of Total table calculation to calculate the percentage of a total amount. For example, what portion of quarterly sales come from each month by using Pane (down). In 2022, January makes up 19.11% of sales made in Q1.

Use Table (down) to calculate the percentage of total sales each month makes within a year. For example, you can see that January makes up 2.94% of sales made in 2022.

Percentile calculation
For each mark in the view, a Percentile table calculation computes a percentile rank for each value in a partition.
Example
Consider this text table. It shows the total sales per month for four years for a large store chain.
Use a Percentile table calculation to rank the total sales for each month in a year as a percentage, rather than a whole number ranking such as 1 to 12.

Since February made a very small amount of sales in 2022 compared to the overall total, it’s ranked as 0.0% (or number 1 out of 12). This example is ascending and therefore ranked from least to most. Sales in January were a bit higher and were therefore ranked as 9.1% (or number 2 out of 12 months). Since November made the most sales in 2022, it’s ranked as 100% (or number 12 out of 12).
Descending vs. Ascending
Ascending order ranks values from least to most. Descending order ranks values from most to least.
Rank calculation
For each mark in the view, a Rank table calculation computes a ranking for each value in a partition.
Example
Consider this text table. It shows the total sales per month for four years for a large store chain.
Use a Rank table calculation to calculate a ranking for each month in a year.

Since September made the most amount of sales in 2022, it’s ranked as number 1. The rank is in descending order, meaning it’s ordered from most to least. Since February made the least amount of sales in 2022, it’s ranked number 12.
Descending vs. Ascending
Ascending order ranks values from least to most. Descending order ranks values from most to least. For Rank table calculation, the default value is Descending.
Rank Type
One issue with Rank calculations is that there may be more than one mark with the same value. What would happen, for example, if Tables in the Central region and Appliances in the South region both had sales of exactly $36,729? Tableau lets you specify how to handle such cases by including an additional field when the Calculation Type is Rank.
The choices are listed here. The number sequence shows how each option would rank a set of four values where two of the values are identical:
| Option | Result |
| Competition (1, 2, 2, 4) | Identical values are assigned an identical rank. The highest value is ranked 1 and then the next two identical values are both are ranked 2. The last value is then ranked 4. |
| Modified Competition (1, 3, 3, 4) | Identical values are assigned an identical rank. The highest value is ranked 1 and then the next two identical values are both are ranked 3. The last value is then ranked 4. |
| Dense (1, 2, 2, 3) | Identical values are assigned an identical rank. The next value after the duplicate values is computed as though the duplicate values were a single value. |
| Unique (1, 2, 3, 4) | Duplicate values are given unique rankings, according to the direction in which the ranking is being computed. |
Running Total calculation
For each mark in the view, a Running Total table calculation aggregates values cumulatively in a partition. It can do this by: summing values, averaging values or replacing all values with either the lowest or highest actual value.
Follow along example
Consider this text table. It shows the total sales per month for four years for a large store chain.
You want to see a running total of sales for each year such that each month’s sales are added to all previous months’ sales.
Create the Basic View
Connect to the Sample – Superstore data source.
Click and drag the Order Date field in the Data pane and drag it to the Columns shelf.
The default date level is YEAR (Order Date).
Click and drag Order Date again and drop it this time on the Rows shelf.
Click on the right side of the field to open the context menu. Then select Quarter.

You’ll see two options named Quarter. Be sure to select the first one.
The field now reads QUARTER(Order Date).
Note: If you’re creating the view on the web, the menu looks a bit different.
Click and drag Order Date a third time and drop it on the Rows shelf to the right of QUARTER(Order Date).
Click the right side of the field to open the context menu. Select Month (again, pick the first of two options named Month). The field reads MONTH(Order Date).
Drag Sales from the Data pane and drop it on Text on the Marks card.
You now have the basic view, showing sales over a four-year period by month, quarter and year.
Add a Running Total table calculation to the basic view
Click the SUM(Sales) field on the Marks card and select Add Table Calculation....
In the Table Calculation dialog box, select Running Total as the Calculation Type.
Select Table (Down) from the Compute Using list.
The highlighting in the view shows how this Compute Using value sets the scope of the calculation in the view:

Comparing the values in the original text view with the values in this view shows that the result is correct. The monthly values ascend steadily. The December value (494,040) is the same value you see if you show column grand totals (from the Analysis menu, select Totals > Show column grand totals).
Click the X in the upper-right corner of the Table Calculations dialog box to close it.
The Running Total can be a different aggregation
For a Running Total table calculation, Tableau can update values cumulatively with other aggregations than sum. Select one of the options from the drop-down list just below the Calculation Type field:
| Aggregation | Meaning |
| Sum | Each value is added to the previous value. |
| Average | The running total averages the current and all previous values. |
| Minimum | All values are replaced with the lowest value in the original partition. |
| Maximum | All values are replaced with the highest value in the original partition. |
Restarting every option
The Restarting every option is only available when you select Specific Dimensions in the Table Calculations dialog box and when more than one dimension is selected in the field immediately below the Compute Using options – that is, when more than one dimension is defined as an addressing field.
Restarting every isn’t available when you defining a table calculation with any other Compute Using option.
You can use this setting to set a break (that is, restart of the calculation) in the view based on a particular dimension.
Restarting every can be useful in the following situations:
With dates or other hierarchies, if you restart every month, as you bring in Year or Quarter, Tableau knows to partition automatically.
With non-hierarchies, Restarting every affects the sorting. If you want to address on Products and partition by State, but you want the products sorted by SUM(Sales) within each state, you need to include States as an addressing field under Specific Dimensions, but then restart every state. Otherwise, the sort by SUM(Sales) would be based on each product's sum of sales across all states.
For example, if you take the result of the Running Total calculation, you can see the effect of Restarting every by doing the following:
Click the SUM(Sales) field on the Marks card and select Edit table calculation.
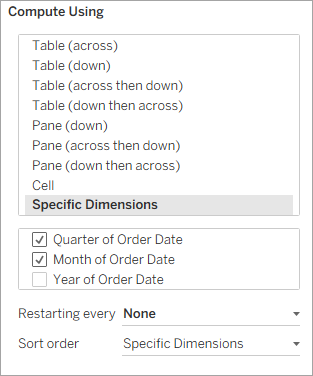
In the Table Calculation dialog box, select Specific Dimensions.
Notice that two dimensions are now checked in the list box of dimensions: Quarter of Order Date and Month of Order Date. These are the addressing fields, and because more than one field is being used for addressing, Restarting every is now available.
The choices available from the Restarting every drop-down list are:
None Specifies that the calculation should be performed at the level of greatest granularity. This is the default option. This option doesn’t change the view. Quarter of Order Date Specifies that the calculation should be performed at the quarter level. If you select Quarter of Order Date, the view updates to show the effect of this change:

The calculation now restarts after every quarter. If you click out of the Table Calculations dialog box (to dismiss the highlighting) you can see this more clearly.
Click the X in the upper-right corner of the Table Calculations dialog box to close it.
Add Secondary Calculation
With Running Total and Moving Calculation table calculations, you have the option to transform values twice to obtain the result you want – that is, to add a secondary table calculation on top of the primary table calculation. For example, you could add an initial table calculation to calculate the running total for sales per month within each individual year, and then a secondary calculation to calculate the year-over-year percent difference for each month from one year to the next.
To do this, first add the primary table calculation, as shown previously. Then continue as follows:
Click the SUM(Sales) field on the Marks card and select Edit table calculation.
In the Table Calculation dialog box, click Add Secondary Calculation.
In the second panel, select Percent Difference From as the Secondary Calculation Type.
You don’t need to change the Compute Using selection: Table (Across) is the right option.

Click the X in the upper-right corner to dismiss the Table Calculation dialog box.
Now your view shows what you needed: a year-over-year percent difference of a running total:

See Also