Build a Pie Chart
Use pie charts to show proportions of a whole. It's a best practice to only use pie charts with a small number of slices.
The basic building blocks for a pie chart are as follows:
- Mark type: Pie
- Colour: Dimension.
- Each member of the dimension is represented as a slice or wedge in the pie. Try to use a dimension with no more than five unique values.
- Angle: Measure. The Angle property appears on the Marks card when the mark type is set to Pie.
To create a pie chart view that shows how different product categories contribute to total profit, follow these steps:
- Connect to the Sample - Superstore data source (if necessary, you can download it from the Tableau Public sample data page(Link opens in a new window)).
- Drag the Profit measure to Columns and drag the Category dimension to Rows.
- Click Show Me on the toolbar, then select the pie chart type. Pie charts require at least one dimension and one or two measures. Aggregate fields, such as Profit Ratio, don't contribute to those requirements.
- The mark type changes to Pie.
- The Profit measure you placed on the Columns shelf, which had been aggregated as SUM, moves to both the Size and Angle properties on the Marks card.
- The Category dimension you placed on the Rows shelf moves to the Colour property on the Marks card.
- Navigate to the Fit menu in the toolbar and select Entire View.
- Click the Size property on the Marks card and drag the slider until the pie chart is the size you want.
- Add labels by dragging the Category dimension from the Data pane to Label on the Marks card.
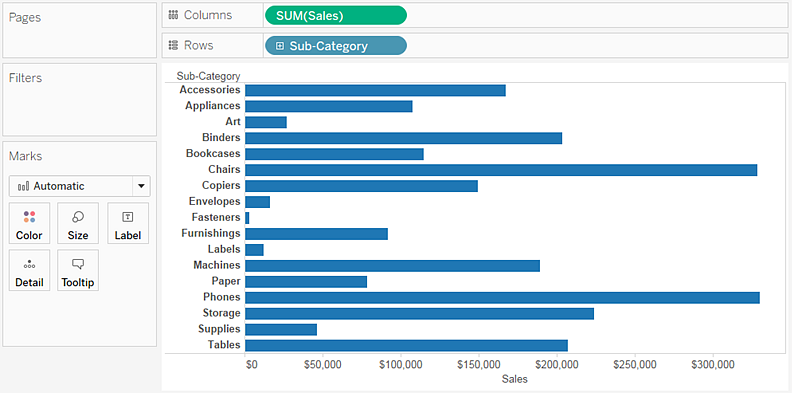
Tableau aggregates the Sales measure as a sum. By default, Tableau displays a bar chart.

Three things happen after you click the pie icon in Show Me:

The result is a rather small pie. To make the chart bigger:

Note: Pie charts can also be used as a mark type in a visualisation. For more information, see Pie mark.