Automatically Build Views with Ask Data
Important changes for Ask Data and Metrics
Tableau's Ask Data and Metrics features were retired in Tableau Cloud in February 2024 and in Tableau Server version 2024.2. With advances in natural language technologies, we're developing an improved interface that will make it easier to ask questions of your data and stay on top of changes. For more information, see How Tableau AI and Tableau Pulse are reimagining the data experience.
Ask Data lets you type a question in common language and instantly get a response right in Tableau. Answers come in the form of automatic data visualisations, with no need to manually drag and drop fields or understand the nuances of your data’s structure.
Ask Data lets you ask sophisticated questions naturally, with support for key analytical concepts such as time series and spatial analysis, and has an understanding of conversational phrases such as "last year" and "most popular."
Navigating to Ask Data lenses
Before you can query a data source with Ask Data, a Tableau author must first create a lens(Link opens in a new window) that specifies the subset of data fields the lens uses.
In Tableau, here are all the places where you can access an Ask Data lens:
- On the All Lenses page at the top level of your Tableau Cloud or Tableau Server site.

- On the Ask Data tab for a data source for which lenses have been created.

- In an Ask Data object on a dashboard.

Ask Data from a lens page or dashboard object
Navigate to a lens and learn more about its data
- Navigate to a lens via the All Lenses page for your Tableau site, the Ask Data tab for a data source, or an Ask Data object on a dashboard.
- (Optional) Under Recommended Visualisations, click an entry to quickly see visualisations the lens author has created for your organisation.
If the recommendations don't address your current data analysis needs, build a query to create your own question.
- In the Data pane on the left, briefly hover over each field to learn more about the data it contains.

In a narrower dashboard object, the Data pane may be hidden, but you can see the same information by clicking the Fields drop-down menu.

Build queries by entering text
- Type in the box reading Search fields or values to create a visualisation.

- As you type, Ask Data searches data fields, functions and string values and displays results in a drop-down list. Click items in the list to add them to your current entry, shown above the search box. To automatically create a viz using the current entry, press Enter at any time.

Modifying a query by searching for fields and analytical functions
A. Current entry B. Current filters C. Search box D. Returned fields E. Returned analytical functions F. Returned field values
Build queries by adding suggested phrases
Tableau will suggest phrases based on the most common queries asked in your lens and by others in your organisation. When you open your lens, you'll notice suggestions that will help you get quick answers to common questions.
You can add these suggestions to your query by clicking them. As you add phrases to your query, the suggestions dynamically update with more relevant phrases. The view automatically builds with each selection.
Build queries by adding fields and filters
- Click Add Field or Add Filter.

- Click the desired field. (To narrow down a long list, first type in the Search Fields box.)

- Set any sub-options, such as aggregation type for a numeric field or grouping for string and date fields.
- To add more fields or filters, click the plus sign.

See how elements of your query are applied
To see how elements of your query are applied, hover over them in the text box or the interpretation above it. Words that aren't used are greyed out, helping you rephrase your query in a way that’s clearer to Ask Data.
Rephrase your question
You can rephrase questions by clicking options, data fields and filters in the user interface.
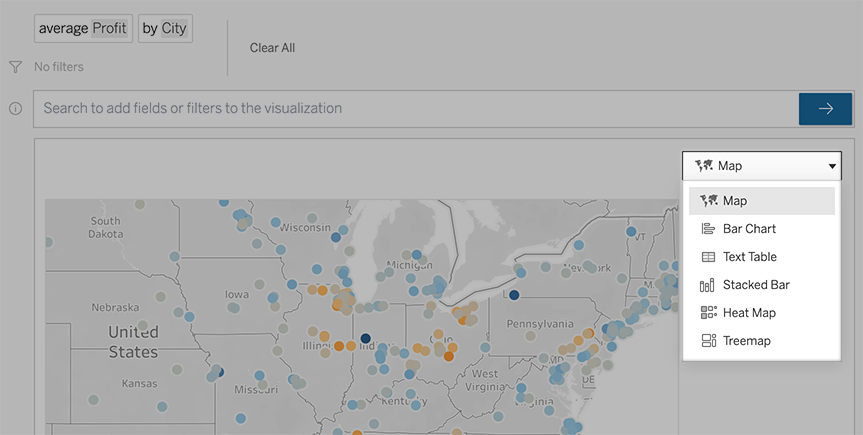
Change the viz type
If the default viz doesn't fully reveal your data, click the menu at upper right, and choose from these supported viz types:
- Bar Chart
- Gantt Bar
- Heat Map
- Histogram
- Line Chart
- Map
- Pie Chart
- Scatter
- Stacked Bar Chart
- Text Table
- Treemap
Note: To automatically create certain viz types, Ask Data sometimes adds fields such as "Number of Records" to your entries.
Change fields, filters and displayed data
Ask Data gives you several ways to fine-tune how field values are displayed.
- To switch the fields used for the vertical and horizontal axes, click the Swap Axes button
 to the left of the viz selection menu:
To change a field, first click on it in your query entry, and then click the field name below. (To change fields used in difference calculations, see Compare differences over time.)

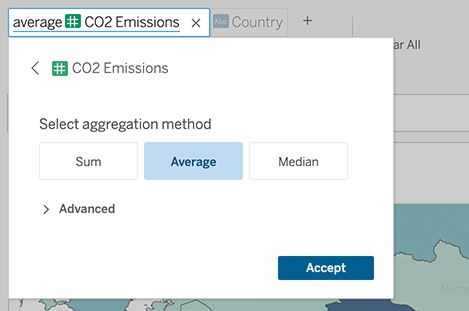
- To change a field's aggregation or grouping type (for example, from average to sum), click on the field name in the text box, and then choose a different aggregation or grouping.
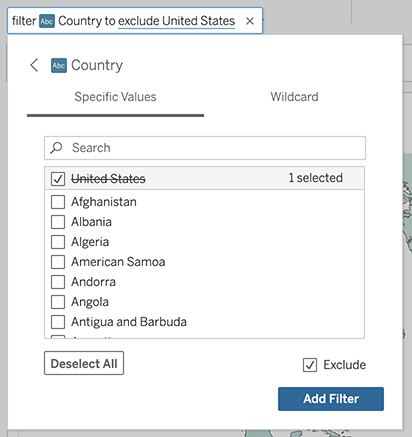
- For categorical filters, click values (for example, "exclude United States" in the example below) to change specific values or enter wildcard parameters.
- To adjust a numeric range, click words such as "high" or "cheap".

To delete a field or filter, hover over it and click the X.
Adjust date filters
To adjust a date filter, click words such as "last" or "previous". Then click one of the following:
- Specific Dates to enter a specific time period or date value
- Relative Dates to show a date range relative to the present day
- Range of Dates to enter specific start and end points
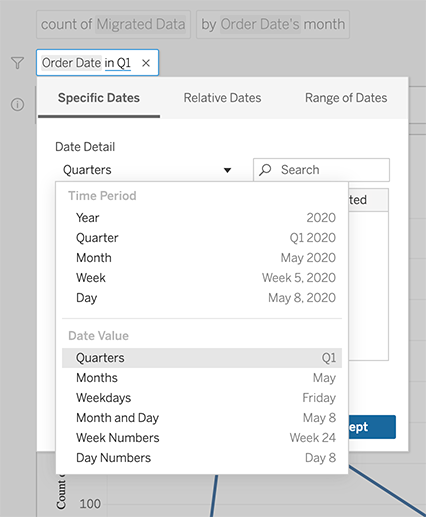
Specific Dates offers some unique options in the Date Detail menu:
- Time Period options show a single continuous date range
- Date Value options show ranges that can repeat in multiple time periods. For example, to see combined sales performance for Q1 across multiple years, under Date Value, you would choose Quarters.
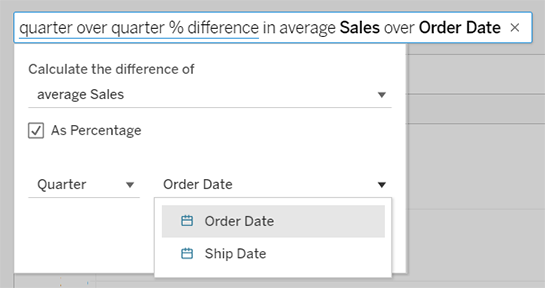
Compare differences over time
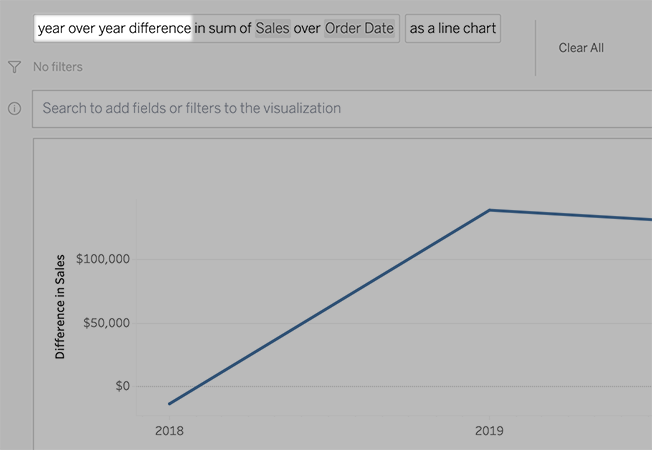
Ask Data lets you compare time periods with phrases such as "year over year" or "quarter over quarter". The results appear as difference or percentage difference table calculations in workbooks you save from Ask Data.
In the text box, click a difference calculation to choose other fields, aggregation methods and time periods.
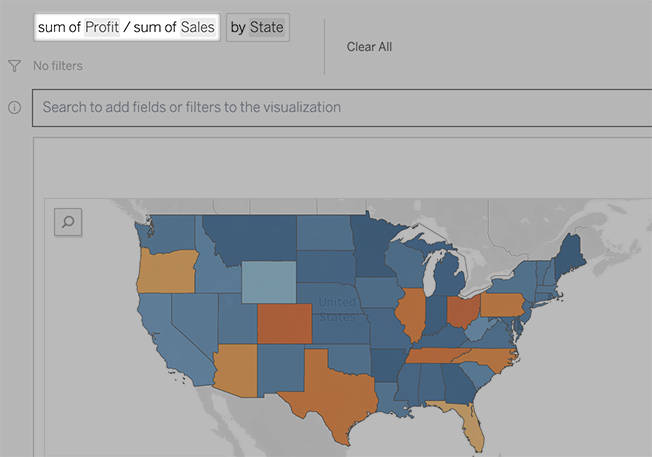
Apply simple calculations
Ask Data supports simple calculations between two measures, which you can apply using these symbols:
+ sums the measures
- produces the difference between them
* multiplies
/ divides
In workbooks you save from Ask Data, these calculations don't become calculated fields but instead ad hoc calculations on the Columns, Rows or Marks shelves.
Add sheets with other vizzes
To quickly create multiple different vizzes from a lens, add sheets in Ask Data.
At the bottom of the web page, do any of the following:
- Click the Add Sheet icon to the right of named sheets.

- Right-click a sheet name, and choose either Duplicate or Delete.
(To rename sheets from Ask Data, you need to save them in a new workbook.)
Share Ask Data vizzes via email, Slack, or a link
You can quickly share Ask Data vizzes with anyone who has access to a lens.
- In the upper right corner of the browser, click on the Share icon.

- Do either of the following:
- To share the viz via email or Slack, enter specific usernames in the text box. (Email and Slack integration must previously be configured by your Tableau administrator.)
- To copy a URL, you can paste into custom emails and other messages, click Copy Link.
Tip: To find your Slack notifications, read Receive Notifications, Search and Share Using the Tableau App for Slack.
Send feedback to the lens owner
If you have questions about the structure of a lens or how best to use it with Ask Data, you can send feedback directly to the author. (This option is enabled by default, but lens authors may disable it.)
- To the left of the query box for Ask Data, click the Ask Data tips icon.
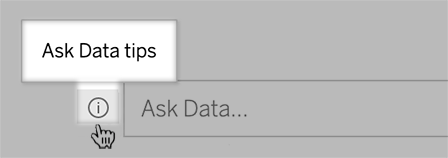
- At the bottom of the tips dialog, click Contact the Lens Author.
Tips for successful queries
As you structure questions for Ask Data, apply these tips to get better results.
Use keywords – For example, instead of "I want to see all the countries that these airports are in", try "by airport and country".
Use exact wording for field names and values – For example, if your lens includes Airport Code, Airport Name, and Airport Region fields, specify those by name.
See a ranked list – Ask Data maps terms such as "best" and "worst" to Top 1 and Bottom 1, respectively. If you want to see broader rankings, use "high" and "low" instead. For example, enter "houses with low sale prices".
Query table calculations – In query expressions for table calculation fields, note that you can't filter, limit or include "year over year difference".
Surround unusually long values with quotation marks – To analyse long field values that contain line returns, tabs or more than ten words, surround them with quotation marks. To improve performance, Ask Data doesn't index fields of that length, or anything beyond the first 200,000 unique field values.