Configure your Data Set
Note: Starting in version 2020.4.1, you can now create and edit flows in Tableau Server and Tableau Cloud. The content in this topic applies to all platforms, unless noted. For more information about authoring flows on the web, see Tableau Prep on the Web in the Tableau Server(Link opens in a new window) and Tableau Cloud(Link opens in a new window) help.
To determine how much of your data set to work with in the flow, you can configure your data set. When you connect to your data or drag tables into the Flow pane, an Input step is automatically added to the flow.
The Input step is where you can decide what and how much data to include in your flow. This is always the first step in the flow.
You can also refresh the data from the Input step. For more information, see Add More Data in the Input Step(Link opens in a new window).
In the Input step, you can:
- Right-click or Cmd-click (MacOS) on the Input step in the flow pane to rename or remove it.
- Union multiple files in the same parent or child directory. For more information, see Union files and database tables in the Input step.
- (version 2023.1 and later) Include automatically generated row numbers based on the original sort order of your data set. See Include row numbers from your data set.
- Search for fields.
- See a preview of field values.
-
Configure the field properties by changing the field name or configure the text settings for text files.
Note: Field values that include square brackets are automatically converted to parentheses.
- Configure the data sample ingested into your flow. See Set your data sample size.
- Remove fields you don't need. You can always go back to the input step and include them later.
- Hide fields that you don't need to clean, but still want to include in your flow output. You can unhide them at any time if you need them.
- Apply filters to selected fields.
- Change the field data type for the data connections that support it.
- (version 2023.3 and later) You can set the header and start row for CSV files.
- (version 2024.1 and later) You can set the header and start row for Excel files.
Include row numbers from your data set
Supported in Tableau Prep Builder version 2023.1 and later and on the web for Microsoft Excel and text (.csv) files.
Note: This option isn’t currently supported for files included in an input union.
Starting in version 2023.1, Tableau Prep automatically generates row numbers based on the original sort order of your data that you can include as a new field in your flow. This is available for Microsoft Excel or Text (.csv) file types only.
In previous releases, if you wanted to include these row numbers, you had to manually add them to the source before adding the data set to your flow.
This field is generated in the Input step when you connect to your data. By default, it’s excluded from the flow, but you can include it in one click. If you choose to include it, it behaves like any other field and can be used in your flow operations and calculated fields.
Tableau Prep also supports the ROW_NUMBER function for calculated fields. This function is useful when there are fields in your data set that can define the sort, such as Row ID or Timestamp. For more information about using this function, see Create Level of Detail, Rank, and Tile Calculations .
Add the Source Row Number field to your flow
-
Right-click or Cmd-click (MacOS) on the field, or click the More options
 menu and select Include Field.
Data Preview:

Field List:

The change list is cleared, the field is now part of the flow data, and you can see the generated row numbers in subsequent flow steps.
Source Row Number details
When you include the Source Row Number in your data set, the following options and considerations apply.
- The data source row numbers are applied before any data sampling or filters.
- This creates a new field called Source Row Number that persists throughout the flow. This field name isn't localized, but can be renamed at any time.
- If a field with this name already exists, the new field name is incremented by 1. For example Source Row Number-1, Source Row Number-2, and so on.
- You can change the field's data type in subsequent steps.
- You can use this field in flow operations and calculations.
- This value is regenerated for the whole data set each time the input data is refreshed or the flow is run.
- This field isn’t available for input unions.
Set header and data start row
Supported in Tableau Prep Builder version 2023.3 and later and on the web for text (.csv) files and in version 2024.1 and later for Excel (.xls) files.
You can set a specific row as a field header row and the row on which the data starts for Excel and text (.csv) files.
When connecting to Excel or text files, a common scenario is that the files are formatted with meta-information in the first few rows to make them human readable. By default, Tableau Prep interprets the first rows of CSV files as the field header row. Excel files are interpreted based on field types and empty rows. Tableau Prep may select a row as the header or not include a header row.
For example, from the following files, STORE DETAILS is interpreted the header row.
You can exclude the metadata information (1) and provide the correct schema structure for your data by setting row 3 as the header (2) and row 4 as the row for the data to start.
CSV files:

Excel files:

For example, the following shows the default settings for the row header and start row:

The following shows the data with the metadata excluded:

Note: The Data Preview doesn’t reflect changes to data sample settings.
Configure the header and start row
Using the Data Preview input view, you can visually inspect the schema structure of your data and set header and start rows to exclude metadata from the input source data.
You can set the data start row to any value that’s higher than the header row value. By default, Tableau Prep sets the data start row to the next consecutive number after the header row. Any rows between the header row and data start row are ignored.
Note: Data Preview and Data interpreter are mutually exclusive. Data Interpreter only detects sub-tables in your Excel spreadsheets and doesn't support specifying the starting row for text files and spreadsheets.
- Select the input step.
- From the toolbar, click the Data Preview input view.
- On the row that you want to set as the header, click the More options menu and select Set as header.
- On the row that you want to set as the data start row, click the More options menu and select Set as data start. By default, the data start row is set to the next consecutive row number.

The Header Options menu displays the header row and the row number for the Data start row. Optionally, you can set the header and start row directly in the Header Options dialog.

Multiple schema in a single file
If a single file includes multiple data sources, you can create an additional input step by connecting to the same data source, then set the header and data start rows for the second data source. For example, the following file contains a data source starting on line number 3 (1) with a different, separate second schema starting on row number 28 (2).


For this type of data source, follow these steps.
- Select the first input step.
- From the toolbar, click the Data Preview input view.
- On the row that you want to set as the header, click the More options menu and select Set as header.
- On the row that you want to set as the data start row, click the More options and select Set as data start. By default, the data start row is set to the next consecutive row number.
- Select the next input step.
- Repeat the steps above for setting the header and start row for additional data sources.
Any rows between the header row and data start row are ignored.
Union multiple tables
Supported in Tableau Prep Builder version 2024.1 and later and on the web for text (.csv) files.
You can union multiple tables from data sources that have the same schema structure and metadata row.
- Connect to the files and select the first input step.
- From the toolbar, click the Data Preview input view.
- On the row that you want to set as the header, click the More options and select Set as header.
- On the row that you want to set as the data start row, click the More options and select Set as data start.
- Click the Tables tab and select Union multiple tables.
- Click Apply to union the files and maintain the header and row selection for all the files in the input union. This assumes that the file structure and schema across input unioned files is the same.

Connect to a custom SQL query
If your database supports using custom SQL, you see Custom SQL displayed near the bottom of the Connections pane. Double-click Custom SQL to open the Custom SQL tab where you can enter queries to preselect data and use source-specific operations. After the query retrieves the data set, you can select the fields to include, apply filters, or change the data type before adding the data to your flow.

For more information about using custom SQL, see Use Custom SQL to connect to data.
Apply cleaning operations in an input step
Only some cleaning operations are available in an Input step. You can make any of the following changes in the Input field list. Your changes are tracked in the Changes pane and annotations are added to the left of the Input step in the Flow pane and in the Input field list.
- Hide Field: Hide fields instead of removing them to reduce clutter in your flow. You can always unhide them if you need them. Hidden fields will still be included in your output when you run your flow.
- Filter: Use the calculation editor to filter values or starting in version 2023.1, you can also use the Relative Date Filter dialog to quickly specify date ranges for any date or date & time fields.
- Rename Field: In the Field Name field, double-click or Ctrl-click (MacOS) on the field name and enter a new field name.
- Change Data Type: Click the data type for the field and select a new data type from the menu. This option is currently supported for Microsoft Excel, text and PDF files, Box, Dropbox, Google Drive, and OneDrive data sources. All other data sources can be changed in a clean step.
Select fields to include in the flow
Note: Starting in version 2023.1 you can select multiple fields to hide, unhide, remove, or include them. In previous releases, you can work with one field at a time and select or clear the check boxes to include or remove fields.
The Input pane shows you a list of fields in your data set. By default all fields are included except the auto-generated field, Source Row Number. Use either the Data Preview or List view to manage your fields.
- Search: Find fields.
- Hide Fields: Hide fields that you want to include in your flow output, but don't need to clean.
- In the Field List, click the eye
 icon or select Hide Fields from the More options menu.
 - In the Data Preview, select Hide Fields from the More options menu.
Fields are processed by the flow during run time. You can also Unhide fields anytime if you need them. For more information, see Hide fields.(Link opens in a new window)
- In the Field List, click the eye
- Include fields: Add fields to your flow that have been marked as removed.
- In the Field List, select one or more rows and right-click, Cmd-click (MacOS), or click the More options menu and select Include Fields to add back fields that are marked as removed.
- In the Data Preview, click the More options menu on the field you want to include in your flow and select Include Field.
- In the Field List, select one or more rows and right-click, Cmd-click (MacOS), or click the More options
- Remove Fields:
- In the Field List, select one or more rows and right-click, Cmd-click (MacOS), click the "X", or click the More options menu and select Remove Fields to remove fields that you don't want to include in the flow.
- In the Data Preview, click the More options menu on the field that you want to remove and select Remove Field.
- In the Field List, select one or more rows and right-click, Cmd-click (MacOS), click the "X", or click the More options
Apply filters to fields in the Input step
Apply filters in the input step to reduce the amount of data that you ingest from your data sources. You can gain interactive performance efficiency and a more useful data sample by eliminating the data you don't want to process when you run the flow.
In the input step you can apply filters using the Calculation Editor. Starting in version 2023.1, you can also use the Relative Date Filter dialog to specify an exact date range of values to include for date and date & time field types. For more information, see "Relative Date filter" in Filter Your Data(Link opens in a new window).
You can use other filter options in the Clean step or other step types. For more information, see Filter Your Data(Link opens in a new window)
Apply a calculation filter
-
In the toolbar click Filter Values. Use one of the following methods to filter your data:
In the Field List, click the More options
menu from the name of the field and select Filter > Calculation ....In the Data Preview, click the More options
menu from the name of the field and select Filter > Calculation ....


-
Enter your filter criteria in the calculation editor.

Apply a relative date filter
- Select a field with a data type of Date or Date & Time. and use one of the following methods to apply a relative date filter.
-
In the Field List, right-click, Cmd-click (MacOS), or click the More options menu from the Field Name column and select Filter > Relative Dates.
- In the Data Preview, click the More options menu from the field, and select Filter > Relative Dates.

-
In the Field List, right-click, Cmd-click (MacOS), or click the More options
-
In the Relative Date Filter dialog, specify the exact range of years, quarters, months, weeks, or days that you want to include in your flow. You can also configure an anchor relative to a specific date, and include null values.
Note: By default, the filter operates relative to the date that the flow is run or previewed within the authoring experience.

Change field names
Use one of the following methods to change the name of a field.
An annotation is added in the field grid and in the flow pane to the left of the Input step. Your changes are also tracked in the Changes pane.
- In the Field List, select a field from the Field Name column and click Rename Field. Type the new name in the field.
- In the Data Preview, select a field and click Rename Field. Type the new name in the field.


Change data types
Currently supported for Microsoft Excel, text and PDF files, Box, Dropbox, Google Drive, and OneDrive data sources. All other data sources can be changed in a clean step.
Note: The data type for Source Row Number (version 2023.1 and later) can only be changed in a Clean step or other step type.
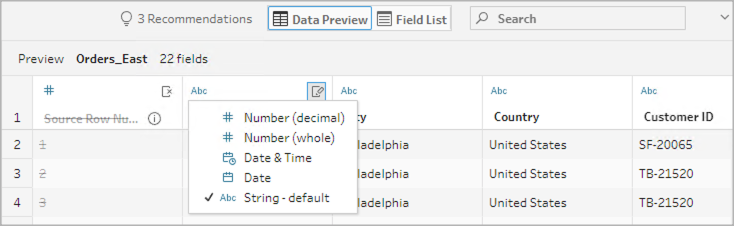
To change the data type of a field, do the following:
- Click the data type for the field.
-
Select the new data type from the menu.
- Data Preview:
- Field View:

You can also change the data type for fields in other step types in the flow or assign data roles to help validate your field values. For more information about changing your data type or using data roles, see Review the data types assigned to your data(Link opens in a new window) and Use Data Roles to Validate your Data(Link opens in a new window).
Configure field properties
When you work with text files, you see a Settings tab where you can edit your connection and configure text properties, such as the field separator for text files. You can also edit the file connection in the Connections pane or configure incremental refresh settings. For more information about setting up incremental refresh for your flow, see Refresh Flow Data Using Incremental Refresh .
When you work with text or Excel files, you can correct data types that have been inferred incorrectly before you even start your flow. Data types can always be changed in subsequent steps in the Profile pane after you start your flow.
Configure text settings in text files
To change the settings used to parse text files, select from the following options:
-
First line contains header (default): Select this option to use the first row as the field labels.
-
Generate field names automatically: Select this option if you want Tableau Prep Builder to auto-generate the field headers. The field naming convention follows the same model as Tableau Desktop. For example F1, F2, and so on.
-
Field Separator: Select a character from the list to use to separate the columns. Select Other to enter a custom character.
-
Text Qualifier: Select the character that encloses the values in the file.
-
Character Set: Select the character set that describes the text file encoding.
-
Locale: Select the locale to use to parse the file. This setting indicates which decimal and thousand separator to use.
Set your data sample size
Stratified row selection is supported in Tableau Prep Builder version 2023.3 and later.
By default, Tableau Prep determines the maximum number of rows required to effectively explore and prepare data for a representative sample of your data. Based on the Tableau Prep sample algorithm, the more fields that are in your input data, the smaller the number of rows allowed.
When data is sampled, the resulting sample may include all the rows you need—or not, depending on how the sample was calculated and returned. For example, by default, Tableau Prep uses the Quick select method to sample data.
Using this method, the top rows are loaded and if your data set is large and the data is structured chronologically, you might see your earliest data sampled, but not a complete representation of all the data. If you don't see the data that you expect, you can change the data sample settings to run the query again.
When creating or editing flows using Web Authoring, the maximum number of rows that a user can select when using large data sets is configured by the Tableau Server administrator. In Tableau Cloud, this limit is fixed and cannot be changed by the administrator. For more information, see Sample data and processing limits in the Tableau Server(Link opens in a new window) or Tableau Cloud(Link opens in a new window) help.
Preparing your data for sampling
If you know that certain values aren’t required for your analysis, remove the fields in the Input step so that the data isn't included when you author or run your flow.
If you have a large data set that triggers sampling, removing fields in the Input step increases the number of rows that Tableau Prep loads. When sampling isn’t applied, removing fields in the Input step reduces the data volume that Tableau Prep loads.
After you’ve removed unnecessary fields and values from the data set, you can change the amount of data loaded for sampling or the sample method.
Changing the data sample settings
Sample data helps with the interactive experience and makes editing the flow more efficient compared to profiling all the data and applying changes to larger data sets as you're working. All data is used when you run the flow. Any changes you make in the sample section apply to the current flow.
To validate your data after cleaning and shaping, run the flow and view the output in Tableau Desktop.
Note: Run the full flow rather than “view sample in Tableau Desktop” so you can see the entirety of your data. If you see unexpected or incorrect values that weren’t in the sample, you can go back into Tableau Prep to address this.
- Remove unnecessary fields and values from the data set.
-
Select an Input step, then click the Data Sample tab.

-
Select the number of rows that you want to load for data sampling. The number of rows you choose has an effect on performance.
- Automatic: (default) loads data quickly and automatically calculates the number of rows so that there’s enough data for a sample. The number of rows loaded is equal to or less than 393,216.
-
Specify: typically used to load a small number of rows so that you can understand the structure of the data and have fast load times. Specify a number of rows less than 1 million.
Note: In Web authoring: The maximum number of rows that a user can select when using large data sets is configured by the Tableau Server administrator. In Tableau Cloud, this limit is fixed and cannot be changed by the administrator. As a user, you can select the number of rows up to that limit.
- Maximum: loads as much data as possible for row selection that is equal to or less than 1,048,576. Ensure that you have the High-Performance Requirements for large data sets.
-
Select the method to use for the number of rows returned for sampling. Performance can be affected when Random or Stratified are chosen.
Note: Row selection is only supported if your input data source supports random sampling. If your data source doesn’t support random sampling, the default method of Quick Select is used.
-
Quick Select: (default) samples data based on performance as the rows are returned as quickly as possible. Some rows may not be included in the sample. The rows used for sampling might be the first N number of rows or the rows that the database had cached in memory from a previous query. While this is almost always a faster result than random sampling, it can return a biased sample (such as data for only one year rather than all years present in the data, if the records are sorted chronologically).
-
Random: allows you to sample a large data set and return a general representation of the entire selection of rows. Tableau Prep returns random rows based on all of the selected rows loaded. This option can affect performance when the data is first retrieved.
- Stratified: allows you to group by a specified field and then sample data within each subgroup. Prep returns the requested number of rows distributed across the selected field for grouping as equally as possible. In some cases, based on the data source, this can result in some values for the field having more rows than others.
-
Examples
These examples are based on the global world indicators data set included with Tableau Prep. The first sample uses Automatic for the number of rows and Random for the sample method or the number of rows to return for sampling.

With these values selected, 3 K rows are selected at random and used to represent the entire data set.

The second sample uses Specify for the number of rows and Stratified for the sample method. The specified number of rows is set to a value of 7 and the Birth Rate field used for grouping.

The new sample values show a unified distribution of 7 rows of unique values across all fields.
