Configure Tableau Data Story Settings: Characteristics
Important changes for Tableau Data Stories
Tableau Data Stories were retired in Tableau Desktop, Tableau Cloud, and Tableau Server in January of 2025 (2025.1). With advances in natural language technologies, we're developing an improved interface that will make it easier to ask questions of your data and stay on top of changes. For more information, see How Tableau Pulse powered by Tableau AI is Reimagining the Data Experience(Link opens in a new window).
Within your Tableau Data Story, you can configure the characteristics settings to give context to your data, so you get more insightful stories. For example, in your story you can specify that in the context of sales, a higher number is good. But in the context of customer complaints, a higher number is bad.
Use dimension and measure characteristics
Your story and number formatting adjusts based on what the measure is. By default, your story writers all measure values as numbers, and your story won't perform any additional calculations or apply any special rendering rules.
- Add a Tableau Data Story to a Dashboard.
- From your dashboard, click the Settings icon at the top-left corner of your Data Story object.
- In the Data Story dialog box, click the Characteristics tab.
- Configure your formatting, such as number type, decimal places, and negative values.
- Click Save.
Learn more about measure characteristics
Formatting
If values are formatted as Percentages, then the story writes about percentage point differences, rather than percent changes as a story would for number values. When you format a number as a Percentage in the Characteristics tab, the Data Story multiplies the value of the number by 100 to create the percentage that shows in your story.
If values are formatted as Currency, then you can specify your preferred currency. You can also specify how you want large values (numbers greater than one million) formatted, for example $1.3 million instead of $1,300,000.00.
For both Numbers and Currency, you can specify how you want large values and negative values to be written about. If you choose to have negative values written about in parentheses, you might see nested parentheses in your story when the negative value is written about in a parenthetical phrase.
When you choose Number formatting, you can also specify whether you want numbers less than or equal to 10 to be spelled out (rather than using a numeral) in your story.
For decimal places, Dynamic is the default option. This means that the story rounds to different decimal places depending on how large or small the number is. If the percent value is less than 10, then the number has two decimal places. If the percent value is greater than 10, then the number rounds to the nearest whole number. You can also specify how many decimal places you want used, which is used consistently throughout your story.
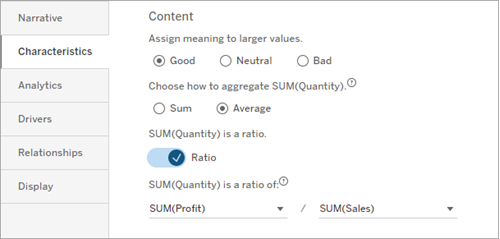
Content
You can assign meaning to larger values. For example, larger values for sales are good, but larger values for losses are bad.
In addition, you can choose how to aggregate values by sum or average. It’s a best practice to choose the same aggregation method that you’re using in the viz. For ratio measures, choose Average and then define the ratio by selecting the component measures of that ratio measure. Measures that are components of a ratio must be summable.
For cumulative measures (available for continuous stories only), choose Sum and then specify that the measure is already cumulative. Continuous stories write about the total of the measure across the series.
Sorting
To sort dimension values, click the arrow up/down icon to sort based on the oldest or newest time values in your dimension.
Note: Sorting dimension values is available for only continuous stories.