Capacity Metrics in Tableau Cloud Manager
Capacity metrics in Tableau Cloud Manager (TCM) provide cloud administrators with visibility into how site capacity resources are being consumed over time. They help you identify when a site is approaching its limits, understand whether high usage is a regular pattern or an isolated event, and decide whether capacity needs to be reallocated.
You can review and monitor capacity metrics in two locations in TCM:
-
Capacities page: Shows consumption data from the past 24 hours for all sites on the tenant.
-
Capacities Metrics page: Shows more detailed trend data for the past 24 and 48 hours for a specific site, including additional concurrency metrics.
Capacity metrics on the Capacities page
The Capacities page shows a high-level view of resource allocation and consumption across all sites on the tenant. The data shown reflects the past 24 hours.
The capacity management dashboard on the Capacities page shows how much of the available capacity is allocated to each site and how much is currently being consumed. Each site row shows usage values alongside its configured limit per capacity type. Consumption is highlighted with yellow or orange indicators when consumption reaches Tableau-defined thresholds.
For more information about these indicators, see Warning, critical, and error indicators section below.
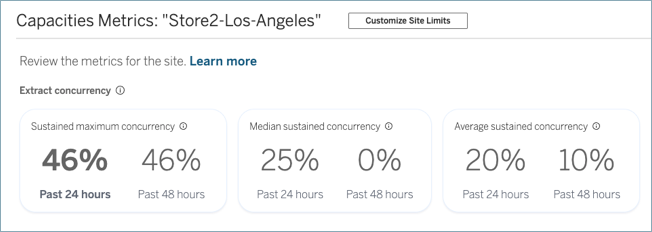
Capacity metrics on the Capacities Metrics page
The Capacities Metrics page shows more detailed consumption data for a specific site, covering the past 24 and 48 hours. This additional time period helps you distinguish between isolated peaks and a potential trend.
To access the Capacities Metrics page:
-
Sign in to Tableau Cloud Manager(Link opens in a new window) as a cloud administrator.
-
In the left-navigation pane, go to the Capacities page.
-
From the capacity management dashboard, click the site you want to review metrics for.
Note: You can use various admin tools and activity logs along with capacity metrics data to correlate specific activities on your site with overall consumption of your site's capacity. This type of information is available for extract concurrency, subscription concurrency, and flow concurrency.
The following metrics are available depending on the capacity type.
Concurrency capacity metrics
Concurrency capacity metrics apply to background jobs: extract refresh concurrency, subscription concurrency, and flow concurrency. They measure the duration of a site's concurrent job capacity that was fully utilized.
| Capacity metrics | Descriptions | What it indicates |
| Maximum sustained concurrency | The highest percentage of time within an hour period that concurrency capacity was fully used. | Highlights peak consumption or insufficient capacity.
Important: A maximum sustained concurrency value greater than 0% indicates that maximum concurrency capacity was reached at some point. Higher percentages mean that maximum consumption occurred on a sustained basis, which can impact task completion time and serving up-to-date data to users. Example |
| Median sustained concurrency | The median value of the percentage of time within an hour period that concurrency capacity was fully used. | Omits outliers and reflects the typical load on the system. Use this metric to understand whether high concurrency is normal or an exception. |
| Average sustained concurrency | The average value of the percentage of time within an hour period that concurrency capacity was fully used. | Sensitive to outliers; reflects the general load trend on the system. Compare with the median to identify whether peaks are skewing the average. |
API usage metrics
API usage capacity metrics apply to rate-limited capacity types: extract APIs, publish APIs, and VizQL Data Service APIs. They measure how much of your hourly API call allowance has been used.
| Capacity metrics | Descriptions | What it indicates |
| Maximum capacity usage | The highest percentage of capacity used within an hour period. | Highlights high call rates or insufficient capacity. High values can indicate that API calls are at risk of failing. |
Warning, critical, and error indicators
The Capacities and Capacities Metrics pages use highlights to help you quickly identify which sites and capacities need attention. The threshold ranges that trigger an indicator differ between concurrency and usage capacity types.
Note: The indicators on the Capacities page cover the past 24 hours. The indicators on the Capacities Metrics page display only on the Past 24 hours capacity metrics card, not on the Past 48 hours capacity metrics card.
Yellow indicator - warning

-
Concurrency capacity type: A yellow (warning) indicator displays when a site's usage for a capacity type reaches 50%-75% of sustained saturation. This is an early sign that the site is under meaningful load.
-
Usage capacity type: A yellow (warning) indicator displays when a site's consumption for a capacity type reaches 85%-99% of its allocated limit. This is an early sign that the site is making a high volume of API calls and approaching the rate limit.
When you see these indicators, consider reviewing the When you see warning, critical, or error indicators section below.
Orange indicator - critical

-
Concurrency capacity type: An orange (critical) indicator displays when a site's usage for a capacity type reaches 76%-100% of sustained saturation. At this level, consequential delays in background jobs are likely to occur and users are at a high risk receiving stale data.
-
Usage capacity type: An orange (critical) indicator displays when a site's consumption reaches 100% of its allocated limit. This means the site has fully exhausted its available capacity for that type. When this happens, API calls might be delayed or fail, which can cause disruption to your users.
When you see these indicators, we strongly recommend reviewing the When you see warning, critical, or error indicators section below.
Red indicator - error

-
All capacity types: A red (error) indicator displays when the site limits in aggregate exceed the limits for the tenant. This can occur when there are changes to the Creator license quantity, which causes compliance issues. This issue should be resolved immediately by reallocating capacity. For more information, see Reduce site limits message.
When you see warning, critical, or error indicators
When you see yellow, orange, or red highlights in the capacity management dashboard, check the Recommendations column.
Sites with Review site limits are candidates for capacity reallocation. When reallocating capacity, consider the following:
-
Click the site name to open the Capacity Metrics page for a more detailed view.
-
For the specific site, click the Actions menu and select Customize Site Limits. For more information, see Capacity Managed in Tableau Cloud Manager.
Sites with Reduce site limits should have the highlighted capacity limits reduced. For more information, see Capacity Managed in Tableau Cloud Manager. To reduce capacity limits, see Capacity Managed in Tableau Cloud Manager.