Blend Your Data
Data blending is a method for combining data from multiple sources. Data blending brings in additional information from a secondary data source and displays it with data from the primary data source directly in the view.
Data blending is particularly useful when the blend relationship—the linking fields—need to vary on a sheet-by-sheet basis, or when combining published data sources.
Options to combine data
There are several ways to combine data, each with their own strengths and weaknesses.
Relationships are the default method and can be used in most instances, including across tables with different levels of detail. Relationships are flexible and adapt to the structure of the analysis on a sheet by sheet basis. Relationships are the best option to combine published data sources.
Joins combine tables by adding more columns of data across similar row structures. This can cause data loss or duplication if tables are at different levels of detail, and joins must be established before analysis can begin. You can't use a published data source in a join.
Blends, unlike relationships or joins, never combine the data directly. Instead, blends query each data source independently, aggregate the results to the appropriate level, then present the results together visually in the view. Blends don't create a new, blended data source (and therefore can't be published as a "blended data source"). Instead, they are simply blended results visualized per sheet.
Steps for blending data
Data blending is performed on a sheet-by-sheet basis and is established when a field from a second data source is used in the view.
To create a blend in a workbook, you need to connect to at least two data sources. Then bring a field from one data source to the sheet—it becomes the primary data source. Switch to the other data source and use a field on the same sheet—it becomes a secondary data source. A linking icon will appear in the data pane, indicating which field(s) are being used to blend the data sources.
- Ensure that the workbook has multiple data sources. The second data source should be added by going to Data > New data source.
Tip: Blending requires two or more distinct data sources, listed independently in the Data pane. Adding another connection to the first data source enables relationships and joins on the Data Source page.
- Drag a field to the view. This data source will be the primary data source.
- Switch to another data source and verify there is a blend relationship to the primary data source.
- If there is a linking field icon (
 ), the data sources are automatically linked. As long as there is at least one active link, the data can be blended.
 - If there are broken link icons (
 ), click the icon next to the field that should link the two data sources. The slash will go away, representing an active link.
 - If a link icon does not appear next to the desired field, see Define blend relationships for blending.
- If there is a linking field icon (
- Drag a field into the view from the secondary data source.
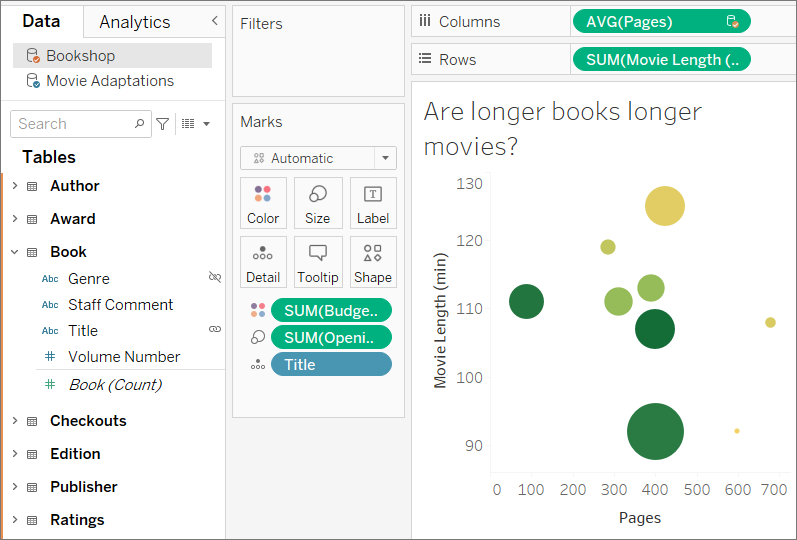
As soon as this second data source is used in the same view, a blend is established. In the example below, our primary data source is Movie Adaptations and the secondary data source is Bookshop.
- The primary data source is indicated with a blue check mark on the data source. Fields from the primary data source used in the view have no indication.
- The secondary data source is indicated with an orange check mark on the data source and an orange bar down the side of the Data pane. Fields from the secondary data source used in the view have an orange check mark.
Understand primary and secondary data sources
Data blending requires a primary data source and at least one secondary data source. The first data source used in the view becomes the primary data source and defines the view. This can restrict values from the secondary data source—only values that have corresponding matches in the primary data source appear in the view. This is comparable to a left join.
For example, if the primary data source has a Month field that only contains April, May, and June, any view built around months will only display April, May, and June, even if the secondary data source has values for twelve months. If the desired analysis involves all twelve months, try switching which data source is primary by rebuilding the sheet and using the other data source first.
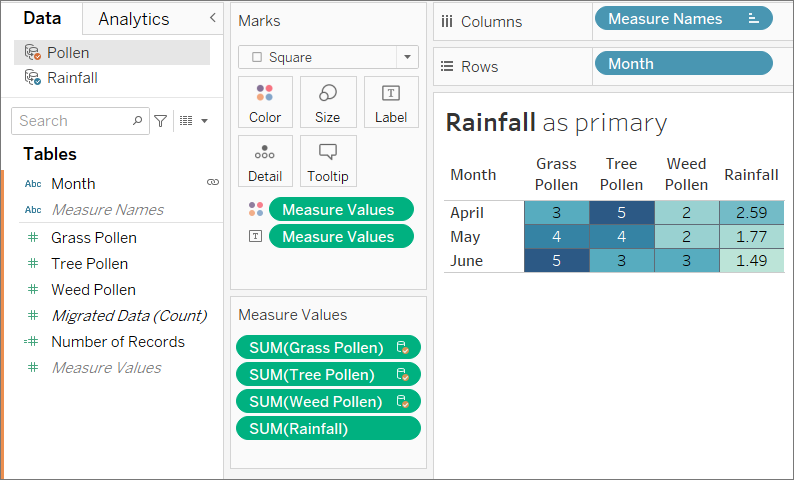
The following examples below use the same data sources linked on the same field, and the viz is built the same way both times. The difference between the results is due to which data source is designated as the primary.
- Here, the Month field from the Rainfall data source is brought into the view first. Because Rainfall only contains three months, when the Pollen data set is added as a secondary, only three months are brought into the view.
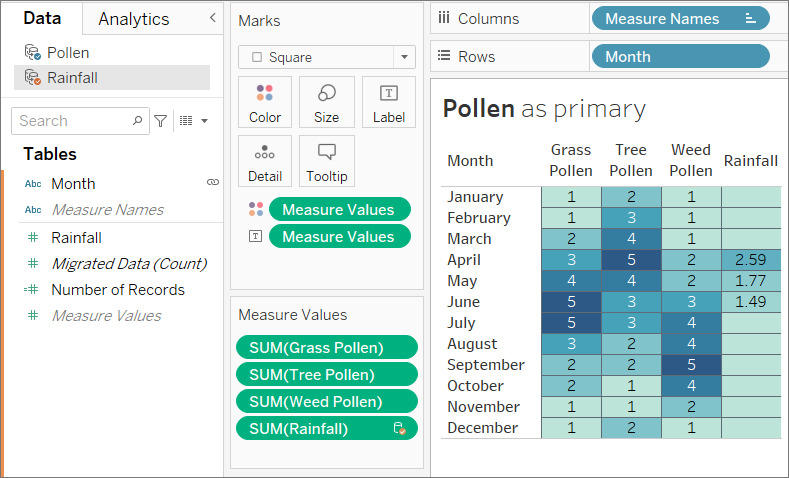
- On another sheet, the Month field from the Pollen data set is brought into the view first. All twelve months are displayed. When the Rainfall data set is added as a secondary, Rainfall is only available for the three months in that data set.
Work across blended data sources
Due to the nature of a data blend, there are some things to keep in mind when working across blended data sources.
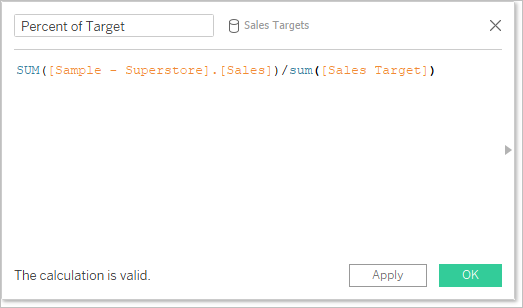
Performing calculations with fields from more than one data source can be slightly different than an ordinary calculation. A calculation must be created in a single data source; the top of the calculation editor indicates which data source the calculation is in.
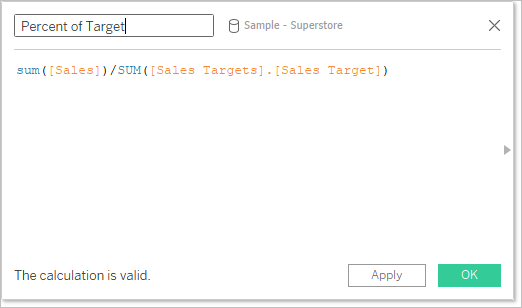
- Aggregation. Any fields used from another data source will come in with an aggregation—by default, SUM, but this can be changed. Because calculations cannot mix aggregate and non-aggregate arguments, fields from the calculation's host data source must also be aggregated. (In the images below, the SUM aggregation was added automatically and the sum aggregation was added manually.)
- Dot notation. Any field referenced in the calculation that belong to another data source refers to its data source using dot notation. (In the images below, for the calculation built in Sample - Superstore, the Sales Target field becomes [Sales.Targets].[Sales Target]. When the calculation is built in Sales Targets, the Sales field becomes [Sample - Superstore].[Sales].)
- These are equivalent versions of the same calculation built in each data source. In both cases, this is SUM(Sales) / SUM(Sales Target).
In addition to handling calculations slightly differently, there are some limitations on secondary data sources. You may not be able to sort by a field from a secondary data source, and action filters may not work as expected with blended data. For more information, see Other data blending issues.
Define blend relationships for blending
In order for Tableau to know how to combine the data from multiple sources, there must be a common dimension or dimensions between the data sources. This common dimension is called the linking field. Active linking fields are identified in the Data pane for the secondary data source with an active link icon (![]() ) and potential linking fields are identified with a broken link icon (
) and potential linking fields are identified with a broken link icon (![]() ). Linking fields are not indicated on the primary data source.
). Linking fields are not indicated on the primary data source.
For example, in a blend of transactional and quota data, a geographic field might be the desired the linking field so you can analyze both quota and performance towards that quota for the same region.
Note: In order for the blend to function, the linking fields must also share values or members. Tableau builds the view of blended data based on the shared values. For example, if Color is the linking field in both data sources, Tableau will match data on "Purple" from the primary and "Purple" from the secondary. But "Lt. Blue" will not map correctly to "Light Blue", so one of them would need to be realiased. Like renaming fields to help Tableau identify linking fields, you can edit aliases for members in those fields. For more information, see Create Aliases to Rename Members in the View.
Establish a link
If the linking field in the primary and secondary data sources have the same name, Tableau automatically creates the relationship. When a primary data source is established (that is, a field is in use in the view) and the secondary data source is selected in the Data pane, any fields with the same name between the two data sources will display a link icon (![]() or
or ![]() ) in the secondary data source. If the related field from the primary data source is used in the view, the link becomes active automatically.
) in the secondary data source. If the related field from the primary data source is used in the view, the link becomes active automatically.
If there are no link icons on the secondary data source, you may need to help Tableau establish the link in one of two ways:
-
If common dimensions don’t have the same name (such as "Title" and "Book Title"), renaming one will let Tableau identify them as common dimensions and establish the link.
-
Alternatively, you can manually define a relationship between the fields in the primary and secondary data sources. See below for more information on creating manual link relationship
There can be as many active or potential linking fields as necessary. Click the broken link icon (![]() ) in the data pane to make the relationship active.
) in the data pane to make the relationship active.
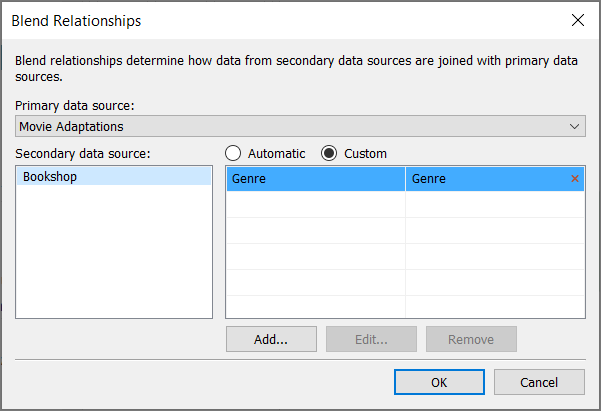
If your common dimensions do not share the same name, you can map the relationship between them manually.
-
Select Data > Edit Blend Relationships....
-
In the Blend Relationships dialog box, verify that the primary data source is selected from the Primary data source drop-down list.
-
Select the secondary data source in the Secondary data source pane. Any existing, automatic blend relationships are visible (and can be deleted by hovering over the row and clicking the x). Select Custom in the relationships list, and then click Add.
-
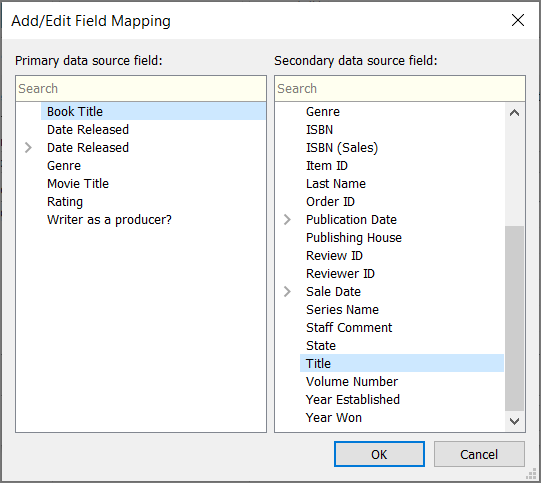
In the Add/Edit Field Mapping dialog box, do the following:
-
Select a field from the primary data source.
-
Select the comparable field from the secondary data source.
-
Click OK.
In this example, Segment is mapped to Cust Segment.
Tip: For dates, the relationship can be specified precisely. Expand the date field and select the desired aspect of the date, such as exact date, month, year, etc.
-
-
Create as many field mappings as desired, then click OK.
Multiple links
As with relationships or joins, there are times when the links between the data sources are defined by more than one field. For example, if regional sales quotas are monthly, a blend between transactional sales data and quota data needs to be established on both region and month for the correct data to be brought together in the view. Multiple links can be active at the same time.
When data is blended based on multiple fields, values are included in the view only where the combination of data from those fields matches across both data sets. Let's look at an example to understand this.
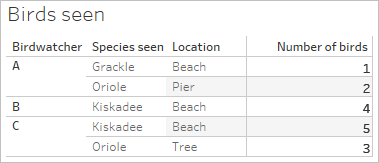
We have two tables, one for birds that were actually seen by birdwatchers, and one for birds that were reported as seen.
 and
and 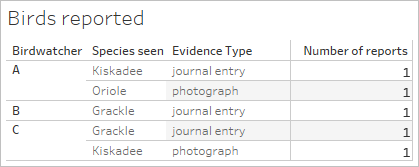
If we set up a blended view with the fields Birdwatchers and Number of birds from the primary data source (Birds seen) and bring in the field Number of reports from the secondary data source (Birds reported), Tableau automatically blends on Birdwatcher.
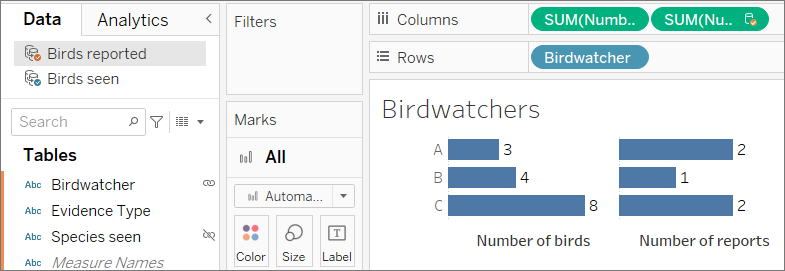
We see that birdwatcher A saw three birds and made two reports, B saw four birds and made one report, and C saw 8 birds and made two reports.
But there's another possible linking field, Species seen. Why not blend on this, too? Will it make a difference?
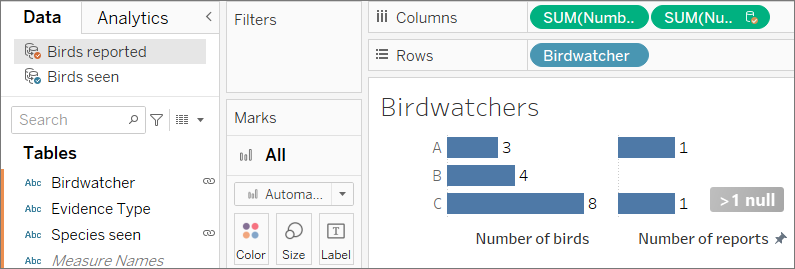
It makes quite a dramatic difference. Now we see that there is only one report each for birdwatchers A and C, and B has a null. What's going on?
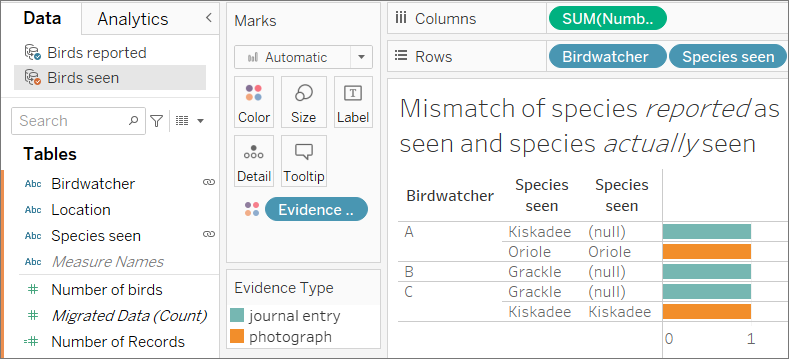
It turns out that these birdwatchers aren't very honest. When they only reported their sightings based on a journal entry (blue bars in the image above), the species they reported seeing didn't match what they actually saw (note the nulls in the second column, from the Birds seen secondary data source). When they backed up the report with a photograph (orange bars), they were honest (both columns of Species seen match).
Because three reports didn't match on species, those rows of data were dropped when Species seen was used as a linking field. The view only shows data where values for both linking fields match.
Takeaway
Be careful when linking on multiple fields. Although it can be very easy to click the icon and establish an active link, over-linking or linking on undesired fields can have a serious impact on the analysis.
Differences between joins and data blending
Data blending simulates a traditional left join. The main difference between the two is when the aggregation is performed. A join combines the data and then aggregates. A blend aggregates and then combines the data.
Left join
When you use a left join to combine data, a query is sent to the database where the join is performed. A left join returns all rows from the left table and any corresponding rows from the right table. The results of the join are then sent back to Tableau and aggregated for display in the visualization.
A left join takes all rows from the left table. The common columns are User ID and Patron ID; where there is corresponding information from the right table, that data is returned. Otherwise, there is a null.


Suppose you have the same tables, but flip the order. This new left join produces different results. Again, a left join takes all the data from the new left table, but essentially ignores a row from the right table. The row of data for User ID = 4 is not included because there is no row for Patron ID = 4 in the left table.
Data blending
When you use data blending to combine data, a query is sent to the database for each data source that is used on the sheet. The results of the queries are sent back to Tableau as aggregated data and presented together in the visualization.
Note: Aggregating measures is straightforward—we can take the sum, average, maximum, or other aggregation of a number with ease. Measure values are aggregated based on how the field is aggregated in the view. However, all fields from a secondary data source must be aggregated. How does that work for dimensions? Dimension values are aggregated using the ATTR aggregate function, which returns a single value for all rows in the secondary data source. If there are multiple values contained in those rows, an asterisk (*) is shown. This can be interpreted as "there are multiple values in the secondary data source for this mark in the view".
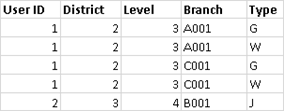
The view uses all values from the primary data source (functioning as the left table) and the corresponding rows from the secondary data source (the right table) based on the linking field(s).
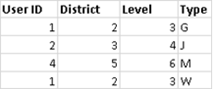
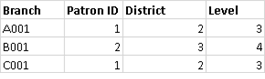
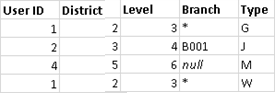
Suppose you have the following tables. If the linking fields are User ID and Patron ID, not all values can be a part of the resulting table because of the following:
-
A row in the left table does not have a corresponding row match in the right table, as indicated by the null value in the results.
-
There are multiple corresponding values in the rows in the right table, as indicated by the asterisk (*) in the results.

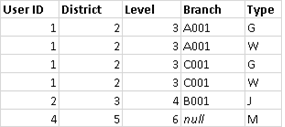
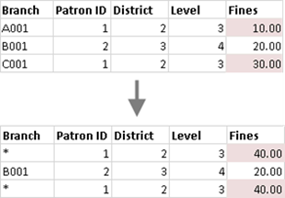
When measures are involved, they are also aggregated, as seen below:
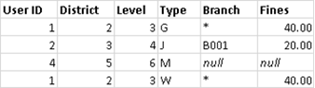
Important: an asterisk (*) in a view with blended data indicates multiple values. This can be resolved by ensuring there is only one matching value in the secondary data source for each mark in the primary data source, potentially by swapping the primary and secondary data sources. For more information, see Troubleshoot Data Blending.
Data blending at a glance
- Data blending occurs on a sheet-by sheet basis.
- The order in which fields are used determines which data source is the primary versus the secondary data source.
- The primary data source is indicated with a blue check mark, any secondary data sources and fields from secondary data sources have an orange check mark.
- Linking fields can be automatically determined based on shared field names or the blend relationship can be manually created.
- Data blending behaves similarly to a left join, which may result in missing data from the secondary data source.
- Asterisks (*) may appear. This indicates multiple dimension values in a single mark, because data blending takes aggregated results and combines them in the view.
- A secondary data source can be used to re-alias the field values in a primary data source. For more information, see Alias Field Values Using Data Blending.
Data blending limitations
- There are some data blending limitations around non-additive aggregates, such as COUNTD, MEDIAN, and RAWSQLAGG. For more information, see Troubleshoot Data Blending
- Blended data sources cannot be published as a unit. Instead, publish each data source separately (to the same server) and then blend the published data sources.
- Data from secondary data sources must always be aggregated in calculations.
- If you are blending a cube data source, it must be the primary data source.