Accessibility Improvements Added by Release
Note: To see all of the features added by Tableau by release, use the Tableau Release Navigator.
Accessibility improvements added in Tableau 25.3
Alt text for filters
Authors can provide context on what a filter changes about a dashboard or visualization to people using screen readers.
To add alt text to a filter:
-
From the toolbar, select Worksheet, then Accessibility.
-
From the Filter Alt Text dropdown, select the desired filter.
-
Enter the alt text in the provided box.
-
Select OK.
Screen reader announcement selection
Tableau Cloud, Tableau Server, and Tableau Public authors can now customize how assistive technology announces marks in a visualization. They can choose to use either mark metadata or mark tooltips for these announcements. By default, screen readers announce mark metadata, a decision we made because not all visualizations include tooltips.
To select mark tooltips for screen reader announcements:
-
From the toolbar, select Worksheet, then Accessibility.
-
Check the Use mark tooltip for alt text on marks box.
-
Select OK.
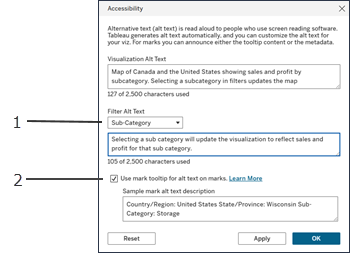
(1) Use alt text for filters.(2) Change screen reader announcement selection.
Accessibility improvements added in Tableau 25.1
Take actions in visualizations
Users can now keep, exclude, and sort data in a tooltip. They can also select and highlight marks on a viz without a mouse.
The ability to take actions in a visualization without a mouse makes it possible for more people to explore, understand, and act on their data. By using the Space, Enter, and Arrow keys, you can keep, exclude, and highlight specific marks.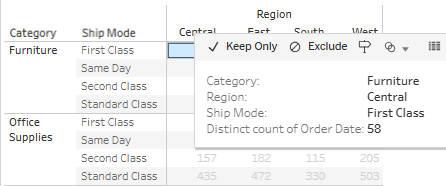
Data model accessibility
With this update, users can use their keyboard to move among tables and related fields in the data model with the Arrow and Tab keys. A screen reader will read out information in tooltips and information about the tables you selected. For relationships, the screen reader will provide context. It tells you which tables to navigate to, depending on the table origin of the relationship.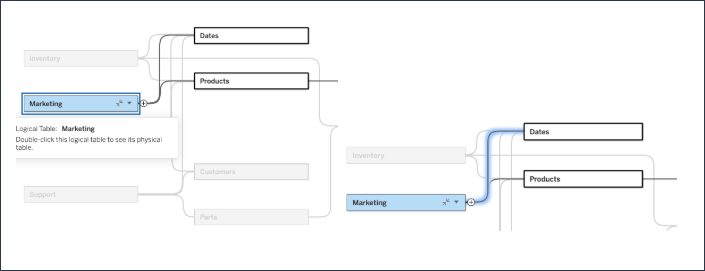
Accessibility Settings: Customize when informational alerts automatically dismiss
By default, alerts used to provide non-critical information automatically dismiss after 5 seconds. With this update, you can change the setting to increase the time to automatically dismiss or to not automatically dismiss non-critical alerts.
-
To change this setting, go to My Account Settings in Tableau Cloud.
-
Select the Settings tab and go to the Accessibility section.
-
Select or deselect the box to automatically dismiss non-critical alerts.
-
Use the arrow keys to increase or decrease the time to dismiss non-critical alerts.
Accessibility improvements added in Tableau 24.3
Viz navigation: all online visualization types
Users can now navigate Marks on all online visualization types on Tableau Cloud by using a keyboard and other assistive technologies.
To activate the experience, go to a visualization and press Enter.
-
Select Enter again to navigate the Marks.
-
Use the Arrow keys to navigate between headers, columns, and rows.
If your visualization has a dual axis, or if it’s a scatter plot or map, an additional navigation affordance appears. Use the Arrow keys to move the focus to a group of marks and select Enter to navigate the marks in the group.
-
To navigate out of the text table, press Esc.
Accessibility improvements added in Tableau 24.2
Viz navigation: all linear visualizations
Users can now use the keyboard to navigate marks in some visualizations, including bar and line charts, combo charts, heat maps, and so on. Visualizations not included are scatterplots and maps. A customer using a screen reader will hear the information for each tooltip.
Linear visualizations follow a natural reading order, such as a line graph.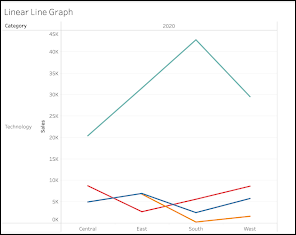
Nonlinear visualizations don't follow a natural reading order, such as a scatterplot.
To activate the experience, simply go to a text table.
-
Select Enter to access the visualization.
-
Select Enter again to navigate the marks.
-
From there, use the Arrow keys to navigate between the columns, rows, and headers.
Accessibility improvements added in Tableau 24.1
Viz navigation: text tables
Users can now use a keyboard only and assistive technology to navigate the marks of a text table. A customer using a screen reader will hear the information for each tooltip.
To activate the experience, simply go to a text table.
-
Select Enter to access the visualization.
-
Select Enter again to navigate the marks.
-
From there, use the arrow keys to navigate between the columns, rows, and headers.
We updated the View Data experience so it can be opened using Shift + Enter.
Accessibility improvements added in Tableau 23.3
Editable alt text
Users now have three ingress points for editing alternative text “alt text” on Cloud and Server. This includes a viz context menu on a dashboard in addition to the worksheet and Data Guide.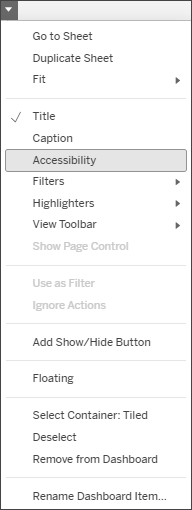
This feature is now available on Tableau Desktop, including all three ingress points.
Alt text only impacts visualizations rendered online.
Accessibility improvements added in Tableau 23.2
Card Accessibility Improvements
We moved content metadata to a popover widget to make it easier to discover. We also added full keyboard navigation (including selection and batch actions) to the grid view. These actions are now available in the mobile browser. We fixed the focus indicator to allow customers to navigate confidently through content.
Editable alt text
Users can now edit the auto-generated alternative text or “alt text” on Tableau Cloud and Server. This can be done through the Data Guide and the Worksheet menu.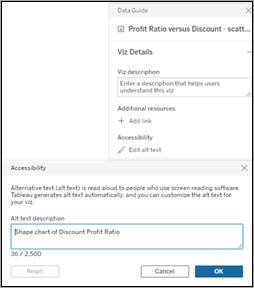
Accessibility improvements added in Tableau 23.1
Auto-generated alternative text
Visualizations now have automatically generated alternative text for customers using screen readers. The alternative text is generated from a formula including the title, visualization type, and information about the columns and rows.
Left Feature Navigation
We removed duplication of labels and added context.
Accessibility improvements added in Tableau 22.4
Thumbnail card links
We replaced complex URLs on thumbnail cards with the name of the content. For example, instead of a screen reader reading "https://help.tableau.com/current/pro/desktop/en-us/accessibility_dashboards.htm," it will read "Build Accessible Dashboards."
Accessibility improvements added in Tableau 21.3
Keyboard navigation order
We updated the default navigation for visualizations to move generally from left to right, top to bottom. We also added a manual process for updating the tab order. See this help document for instructions.
High-contrast color palettes
We added high-contrast color palettes for visualizations.