Actions by All Users
The Actions by All Users view gives you insight into how your Tableau Server installation is being used. You can filter the view by actions and by time range.
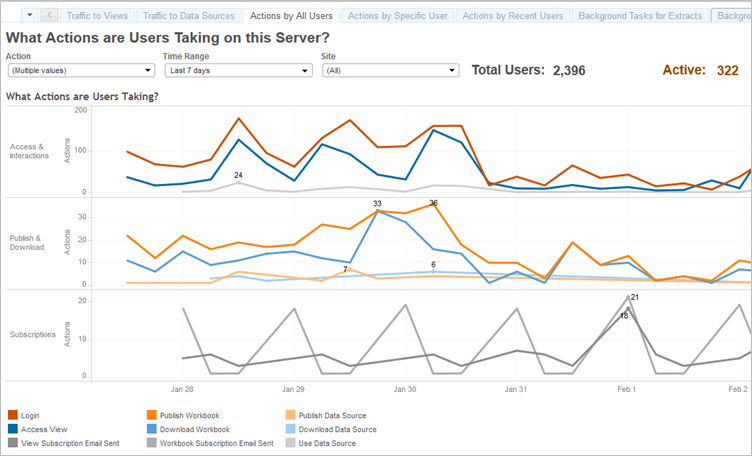
Up to three separate groups of time lines show you how users are using Tableau Server over a time range you specify (the default is the last 7 days). If no actions are selected for a particular group, that group does not display. Possible groups are:
- Access & Interactions—This shows you sign in (log on) activity, view access and data source use.
- Publish & Download—This shows publishing and downloading of flows, workbooks and data sources.
- Subscriptions—This shows counts of subscription email sent for workbooks and views. It also shows the counts of flow runs.
Use the legend at the bottom to view a subset of the displayed actions. Click a single action to highlight the line for the action, or Ctrl + Click on multiple actions to highlight more than one. To clear the selection and display all the selected actions, click on any action in the legend.