Stack Marks
Stacking marks is relevant when your data view includes numeric axes. That is, at least one measure has been placed on the Rows or Columns shelves. When marks are stacked, they are drawn cumulatively along an axis. When marks are not stacked, they are drawn independently along an axis. That is, they are overlapping.
Stacking marks is particularly useful for bar charts which is why Tableau automatically stacks bars. You might find that stacking marks is useful for other marks such as lines as well.
You can control whether marks are stacked or overlapping in any given view by selecting the Analysis > Stack Marks menu item.
You can either allow Tableau to automatically select whether the marks are stacked or you can specify On or Off. The default setting is Automatic. When you are in automatic mode, the Stack Marks menu shows whether stacked marks is on or off.
Selecting On or Off on the Stack Marks menu, switches into manual mode. Your selection remains throughout any changes you make to the view.
The following examples illustrate stacking marks.
Example: Stacking Bars
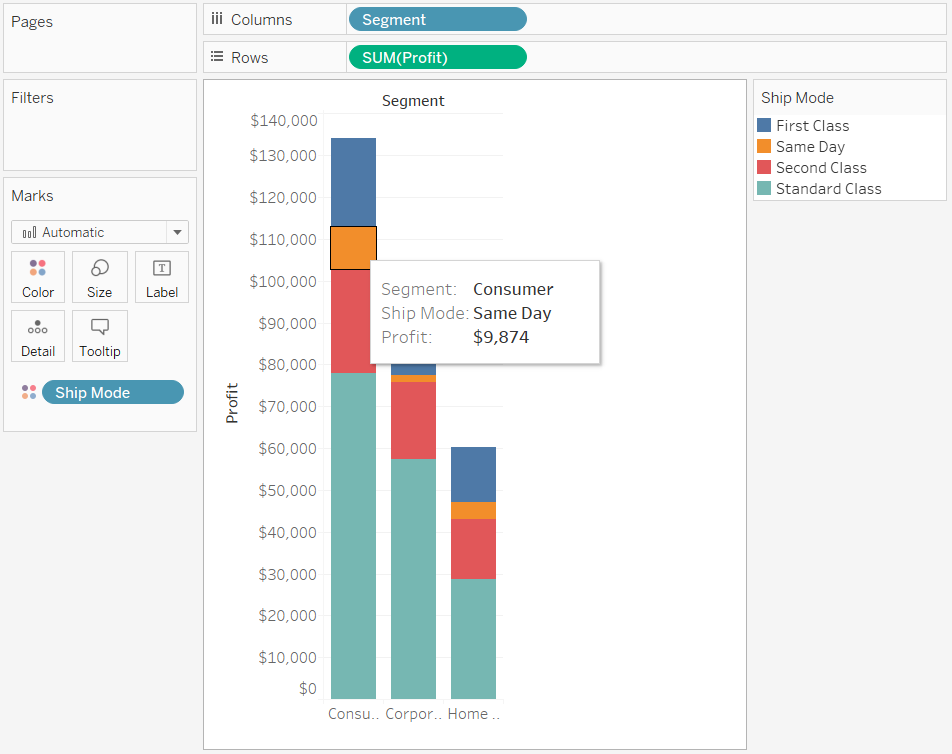
Consider the stacked bars view shown below. It was created by placing a dimension on the Columns shelf, placing a measure on the Rows shelf, and color-encoding the data by a dimension (that is, dropping a dimension on Color on the Marks card).

Example: Stacking Lines
Consider the data view shown below. It was created by placing a date dimension on the Columns shelf, placing a measure on the Rows shelf, and color-encoding the data by a dimension (that is, dropping a dimension on Color on the Marks card). Because the mark type is Line, the marks are not automatically stacked. Instead, they are drawn independently from the horizontal axis.

