Monitor Data Exports Using the Activity Log
Monitoring how your company’s data is being used is an important part of being an admin. Using the Activity Log, you can see data exports in real time to maintain data security and compliance.
This topic describes how admins can use different event types to see which users have exported data, including:
-
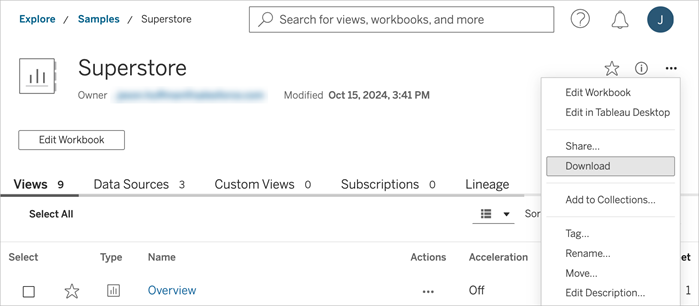
Downloading published content: This refers to the download of workbooks, data sources, and flows published on your Tableau Cloud site.
-
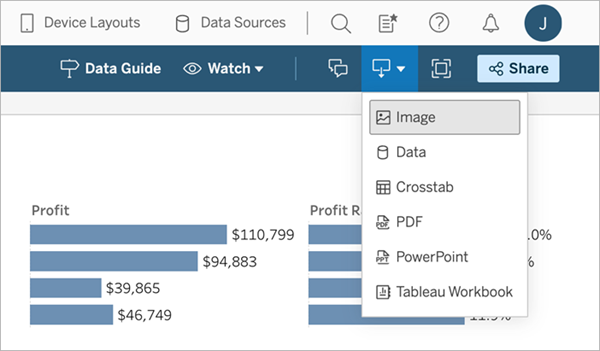
Accessing or exporting data from published content: This refers to the export of data from published views or dashboards. For example, downloading an image of the view in .png format or exporting data as a comma-separated value (.csv) file.
Prerequisites
To monitor data exports, your Activity Log data must be in a structured and queryable format. Make sure that these prerequisites are met before you continue:
-
Activity Log configuration: Set up Activity Log to write log files to your AWS S3 bucket.
-
Data import: Import the log files generated by Activity Log into a monitoring tool, such as Splunk or Amazon EventBridge. Alternatively, you can import them into a cloud data warehouse like Snowflake or Google BigQuery. The goal is to get your data into a format that you can easily query and analyze.
Note: The process of importing your Activity Log data into a data store isn't covered in this topic. For detailed instructions, refer to Set Up Activity Log and the documentation for your chosen data platform.
Reasons to monitor data exports
You can use Activity Log to monitor data exports for these scenarios:
-
Enhanced security and compliance: Identify if sensitive information was exported without authorization. This helps make sure internal security policies and external regulatory compliance requirements are met, such as GxP, GDPR, or HIPAA.
-
Data governance: Knowing who's exporting what data helps you control your data assets. With more visibility, you can find cases of data replication, misuse, or unintended data sprawl. This helps make sure your data governance policies are followed.
-
Understanding user behavior: Analyzing data export patterns can show how users interact with your data. This can help you decide on data access policies, identify areas for additional training, or ways to make data easier to find.
Understanding export events in Activity Log
We've covered why monitoring data exports is important, but let’s discuss how user actions appear in Activity Log. This section helps you identify the specific actions users take on a site and their corresponding Activity Log events.
Depending on how data was exported, you may need an endpoint filter for the event type.
Download from action menus
This table shows how download actions taken on Tableau Cloud content menus appear in Activity Log.
| User Interaction | Activity Log Event Name | Endpoint Name (endpointName) |
|---|---|---|
| Download Workbook | hist_download_workbook | N/A |
| Download Data Source | hist_download_datasource | N/A |
| Download Flow | hist_download_flow | N/A |
Example
To see which users have exported a workbook:
-
Open the monitoring tool you’ve set up, such as Splunk or Amazon EventBridge.
-
Filter on
endpointName = hist_download_workbook.
Export from views
This table shows how export actions taken on views appear in the Activity Log. For more information about specific export formats, see Download Views and Workbooks(Link opens in a new window) in Tableau Desktop and Web Authoring Help.
Note: The Activity Log doesn't record exports (such as PNG, CSV, or PDF) initiated using the Tableau REST API.
| User Interaction | Activity Log Event Name | Endpoint Name (endpointName) |
|---|---|---|
| Export Summary Data | hist_export_summary_data | N/A |
| Export Underlying Data | hist_export_underlying_data | N/A |
| Export Workbook* | hist_download_workbook | N/A |
| Export to Image | vizql_http_request | executeCommand.tabsrv.export-image-server |
| Export to Crosstab* | vizql_http_request | executeCommand.tabsrv.export-crosstab-to-excel-server |
| Export to CSV* | vizql_http_request | executeCommand.tabsrv.export-crosstab-to-csvserver |
| Export to PDF* | vizql_http_request | executeCommand.tabsrv.export-pdf-server |
| Export to PowerPoint* | vizql_http_request | executeCommand.tabsrv.power-point-export-server |
*A confirmation dialog is displayed for this download format. If users proceed, a getSessionTempFile endpoint is recorded in the logs. No value is recorded if users close the dialog without confirming.
Example
To find users who have exported to CSV:
-
Open the monitoring tool you’ve set up, such as Splunk or Amazon EventBridge.
-
Filter on these values:
-
eventType = vizql_http_request. -
endpointName = executeCommand.tabsrv.export-crosstab-to-csvserver. -
endpointName = getSessionTempFile.
-