Author Visualizations with Assistive Technologies
Starting in Tableau 2026.1, you can author and edit visualizations on Tableau Cloud and Tableau Public using only a keyboard. This keyboard-only functionality allows users to create content without a mouse, offering a consistent experience for those who use screen readers or prefer keyboard navigation. Tableau provides announcements as you navigate, ensuring you understand which part of the interface is in focus.
Build a view using your keyboard
You can navigate the Data pane, add fields to the visualization, and rearrange items on shelves using standard keyboard strokes.
Add fields to the worksheet from the Data pane
-
Use the Tab key to move focus to the Data pane.
-
Use the Up and Down Arrow keys to move through the list of fields.
-
To select or unselect a field, press the Spacebar. To select a field and open its context menu, press Enter.
Using the context menu gives you the ability to place the field exactly where you intend on the visualization.
-
From the context menu, select Add to from the menu.
-
Use the Arrow keys to select the location where you want to place the field. As you Arrow through the locations, an orange focus indicator appears on the target areas, such as on the Columns shelf or the Pages card.
-
Press the Spacebar to drop the item in the specified location. Tableau adds the field to the view and updates the visualization immediately.
When the field is dropped on the specified location, the focus returns to the Data pane.
If you'd like to cancel an action or close the context menu without making a selection, press Esc. This will return the focus to the field in the Data pane.
You can also build a visualization using your keyboard by interacting with the Show Me panel. To learn more about building a view with Show Me, see Use Show Me to Start a View.
Configure options for Filters and Marks cards
When you drop a field onto Filters or the Marks card, you need to complete a few more steps.
For Filters:
-
Drop the field onto the Filters card. The filter configuration dialog opens.
-
Use the Tab key to move between sections of the filter dialog (For example, General or Condition).
-
Press Enter to open a section or list of options.
-
Navigate through the available options using the Arrow keys.
-
Press Enter again to select the items you wish to filter.
-
After the filter is configured, press Tab until you reach the desired action button (For example, Reset, Apply, Cancel, or OK).
-
Press Enter to confirm your choice. The filter saves and the dialog closes automatically.
For the Marks card:
-
Drop the desired field on the Marks card.
-
Use the Arrow keys to select the specific visual property for encoding (For example, Color, Size, Label).
-
Press the Spacebar to place the field on that encoding box.
To configure settings for an existing field on the Marks card:
-
Make sure that the relevant card or field is in focus, then press Enter to open its context menu for more visualization options.
-
Use the Tab key to move through the various settings within the menu (For example, in the Color card, navigate through Edit Colors, Opacity, Border, and Halo).
-
With the setting in focus, adjust the value using the Arrow keys. For example, with Opacity in focus, use the Left or Down Arrow keys to decrease the opacity and the Right or Up Arrow keys to increase it.
Interact with fields on the visualization with a keyboard
A field that has been placed on a visualization is often called a pill. You can move them to a different location, copy them to a different location, and remove them from the visualization, but the keyboard strokes are slightly different.
-
Use the Tab key to move through the worksheet until the pill you'd like to interact with is in focus.
-
Press Enter to open the pill's context menu.
-
Use the Arrow keys to navigate to your next action, such as Move to or Copy to, and press Enter again.
-
If you're moving or copying the pill, use the Arrow keys to select the location where you want to place the pill. As you Arrow through the locations, an orange focus indicator appears on the target areas.
-
Press the Spacebar to move or copy the item to the new location.
-
If you're removing a pill from the visualization, use the Arrow keys to navigate to Remove, and press Enter.
The focus remains in place. For example, if you've copied a pill to the Rows shelf, the focus remains on the Rows shelf.
Keyboard controls for authoring
Visualization authoring keystrokes
Use these keyboard controls to build visualizations without a mouse.
| Action | Keystrokes |
|---|---|
| Move the focus forward through the visualization elements | Tab |
| Move the focus backward through the visualization elements | Shift + Tab |
|
Select and open a context menu Expand or collapse a card |
Enter |
| Open context menu | Enter or Shift + F10 |
| Select or unselect an item in the schema | Spacebar |
| Move pill left | Ctrl + Left Arrow |
| Move pill right | Ctrl + Right Arrow |
| Cancel the action and return to the last location | Esc |
Drag-and-drop keystrokes
Use these keyboard controls to drag-and-drop items without a mouse.
| Action | Keystrokes |
|---|---|
| Enter drag-and-drop mode | Press Enter on a destination (for example, Columns) through the context menu |
| Move forward | Right or Down Arrow |
| Move backward | Left or Up Arrow |
| Drop item | Spacebar |
| Cancel | Esc |
Walkthrough: Add a field to the worksheet using a keyboard in three steps
Step one: From the Data pane, use the Arrow keys to navigate to a field, and then press Enter to select it and open its context menu.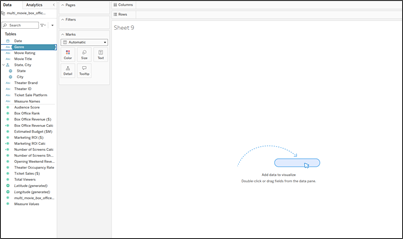
Step two: Navigate the options using the Arrow keys, and then press Enter. For example, move the selection to Add to and press Enter.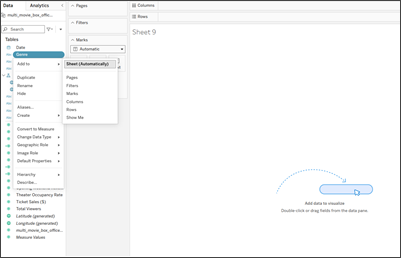
Step three: Use the Arrow keys to navigate to the desired location for the field, such as Sheet (Automatically), and then press Enter.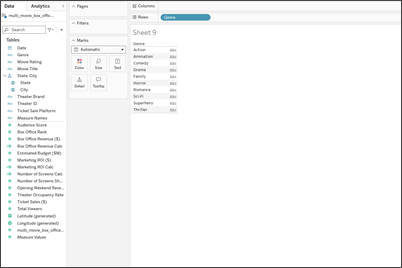
Tableau automatically creates a viz with the field, dropping in the most logical location based on the data type and the current view.