Create Lenses that Focus Ask Data for Specific Audiences
Important changes for Ask Data and Metrics
Tableau's Ask Data and Metrics features were retired in Tableau Cloud in February 2024 and in Tableau Server version 2024.2. With advances in natural language technologies, we're developing an improved interface that will make it easier to ask questions of your data and stay on top of changes. For more information, see How Tableau AI and Tableau Pulse are reimagining the data experience.
Most people don’t need information from an entire data source but instead want data visualisations relevant to their job function, like sales, marketing or support. To optimise Ask Data for different audiences like these, Tableau authors create separate Ask Data lenses, which query a selected subset of fields. For the selected fields, authors can specify synonyms for field names and values, reflecting terms the lens audience uses in common language (for example, "SF" for "San Francisco"). Lens authors then customise the recommended visualisations that appear below the Ask Data query box, which provide answers to users with a single click.
Note: Ask Data lenses can be created only for data sources published separately from a Tableau site. Lenses can't be created for data sources embedded in workbooks or those with a virtual connection.
Create or configure a lens page on your Tableau site
On your Tableau site, each lens has a separate page where users can query Ask Data and authors can configure lens fields, synonyms and suggested questions.

A lens page on a Tableau site
- To create a lens page on your Tableau site, go to a data source page, and choose New > Ask Data Lens.
To configure an existing lens, go to the lens page on your site. (From an Ask Data object in a dashboard, you can click the pop-up menu in the upper corner and choose Go to Lens Page.)
- If you're creating a new lens, enter a name, description and project location, and then click Publish Lens.
- At the top of the Fields pane at left, click the pencil icon. Then select the relevant fields for lens users, and click Save.

On the left, hover over individual tables or fields, and click on the pencil icon:

Then do any of the following:
- Provide a more representative name by clicking on the pencil icon to the right.

- Add common synonyms for field names and values that lens users may enter in their queries.
- Edit descriptions that appear when users hover over fields.
- Provide a more representative name by clicking on the pencil icon to the right.
Change the list of recommended visualisations
To address common queries from lens users, you can customise the recommended visualisations that appear below the query box.
Add or replace a recommended visualisation
- Enter a query into the text box, and press Enter or Return.
- After the visualisation appears, from the pin icon in the toolbar, choose either Pin to Recommended Visualisations or Replace Recommendation.

- For a new recommendation, enter a name and choose the section in which you want it to appear. For a replacement recommendation, choose the existing one you want to overwrite.
Edit section titles and recommendation names, or delete recommendations
- To edit a section title, click the pencil icon
 to the right of the title.
 - To change the name of a recommendation, hover over it and click the pencil icon . To delete a recommendation, click the X.

Add an Ask Data lens to a dashboard
On a dashboard, you can add an Ask Data object that lets users query a published data source via a lens on your Tableau site.
- While editing a dashboard in Tableau Cloud or Tableau Server, drag the Ask Data object to the canvas.
Note: In Tableau Desktop, you can also drag an Ask Data object to the canvas for placement purposes. But to select a lens, you will need publish to Tableau Cloud or Tableau Server and edit the object there.

- Select a published data source previously connected to the workbook.
- To use an existing lens, select it and click Use Lens.
Or, to create a new lens, do one of the following:
- If there are no lenses for the data source, click Go to Data Source Page.
- If lenses already exist, click the data source name at the bottom of the dialog.
- (New lenses only) Complete the steps in Create or configure a lens page on your Tableau site.
- Under Toolbar Options for Lens Users, select the buttons you want available to users.
- Add Visualisation to Pins lets users add to the Recommended Visualisations list, which appears just below the query box.
- Publish as Workbook lets users save visualisations as workbook sheets to their Tableau site.
- Share Visualisation lets users share via email, Slack or a link.
In the lens, the publish (save icon), pin and share options appear in the upper right corner:

(New lenses only) After you finish creating the lens, return to the Lens object in your dashboard and click Refresh. Then select the new lens, and click Use Lens.
Apply a different lens to an Ask Data dashboard object
- From the pop-up menu at the top of the object, choose Configure.

- Go to Add an Ask Data lens to a dashboard, and repeat steps 2 onward.
Change a lens name, description or project location
- Navigate to the lens page on Tableau Cloud or Tableau Server.
- To the right of the lens name at the top of the page, click the three dots (...), and choose Edit Workbook.
- Click Edit Lens Details.
See how people use Ask Data with a lens
For data source owners and lens authors, Ask Data provides a dashboard that reveals the most popular queries and fields, the number of visualisation results that users clicked and other helpful information. Filters let you narrow data down to specific users and time ranges. These stats help you further optimise a lens to increase the success of your users.
Note: If you use Tableau Server, you can access this data in the Tableau Server Repository to create custom dashboards.
- In Tableau Server or Tableau Cloud, navigate to a lens page.
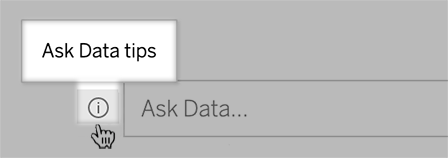
- To the left of the Ask Data text box, click on the "Ask Data tips" icon.
- In the lower-left corner of the tips dialog, click Usage Analytics.
Let users email you questions about a lens
As a lens owner, you can allow users to email you with questions about data structure, expected results and more. This option is on by default, but you can turn it off using the steps below.
- In Tableau Server or Tableau Cloud, navigate to a lens page.
- To the left of the Ask Data text box, click on the "i" shown above in See how people use Ask Data with a lens.
- At the bottom of the tips dialog, click on the eye icon next to "Contact the Lens Author" to enable or disable feedback.

Permissions for publishing and viewing lenses
For Ask Data objects in dashboards, no change to permissions should be required: by default, existing workbook authors can create lenses, and existing dashboard audiences can view them. But for reference, here's a detailed outline of required lens permissions for both dashboards and direct access via a data source page.
To create and publish a lens, a user needs:
- The Creator or Explorer user role
- Lens Creation permission for the data source (inherited by default from the Connect permission)
- Write permission for the parent project to which the lens is published
To access and interact with a published lens, a user needs:
- The Viewer role or above
- Connect permission for the data source
- View permission for the lens
Note: By default, lens permissions like View reflect a project's permissions for workbooks. If Tableau administrators want to change default lens permissions, they can do so either individually for each project, or in bulk using the permissions API.